
Change your data columns to rows in Pardot B2B Marketing Analytics/Tableau CRM
Has this ever happened to you? You wish you could change your Pardot B2BMA data from columns to rows.
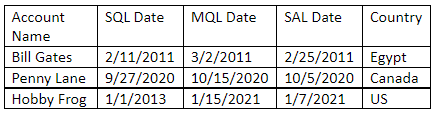
You have all the Pardot B2B Marketing Analytics data you want in a single column, but you need to create B2BMA reports that show the data as rows.
For Example:
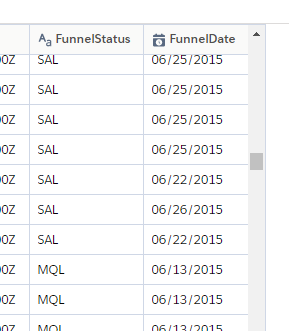
Your data looks like this.
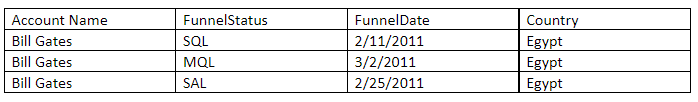
But you want the data to look like this.
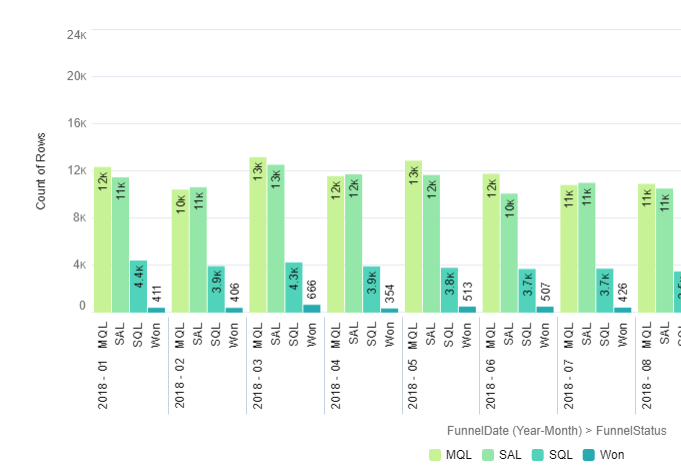
So you can make visuals like this!
And you want to do this without using a complicated query on the front end of your dashboard that could limit the ability to filter and sort the data…
There are many ways to accomplish this. But one of the simplest and most manageable methods is through a data recipe using the Append (UNION) and transform filters. This approach allows you to tweak your rules and data without code on the front end so you can keep your dashboard creation options flexible.
Changing Pardot B2BMA data columns to rows
Step 1: Figure out what fields and filters to add.
The first step is to identify the rules.
- What determines each type?
- Which fields are needed for the data visual?
- What filters do you want to include?
In our example, we know the MQL (Marketing Qualified stage) has been reached if the “Date__Qualified” date is greater than 1971-01-01’. Each stage has its own rules.
To create our dataset, we need to determine what fields and filter to add:
- MQL Status (rules fields) and MQL Date
- SQL Status (rules fields) and SQL Date
- SAL Status (rules fields) and SAL Date
Filters: Country, Account name
When creating your dataset, be sure to document what fields are needed. Keep the field list as small as possible (you can always add more fields later if needed). Less is more for performance and useability in this case.
Step 2: Choose the fields you need.
Open your data recipe and select the dataset. Choose only the fields you need. This will keep the dataset manageable. You should pick all the fields needed to create the rules and the fields you will use to filter. Document everything you select as you will be repeating this process for each row type.
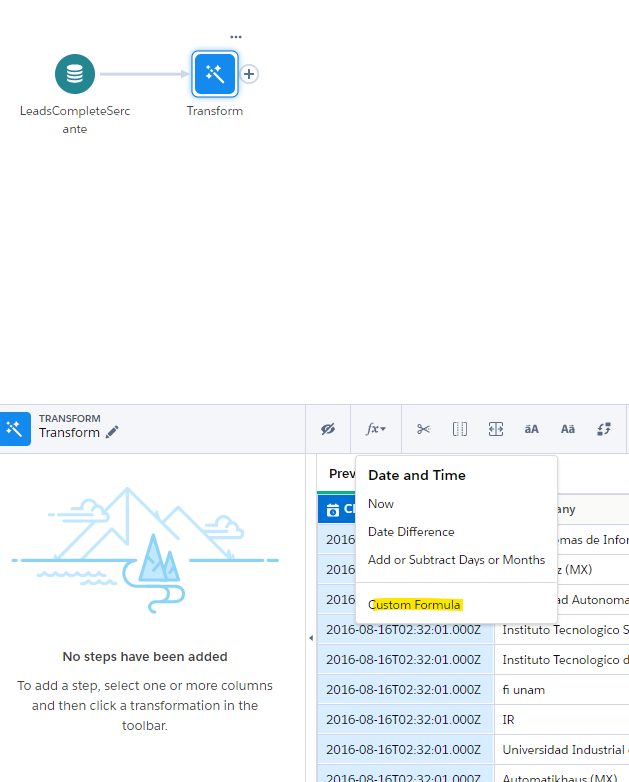
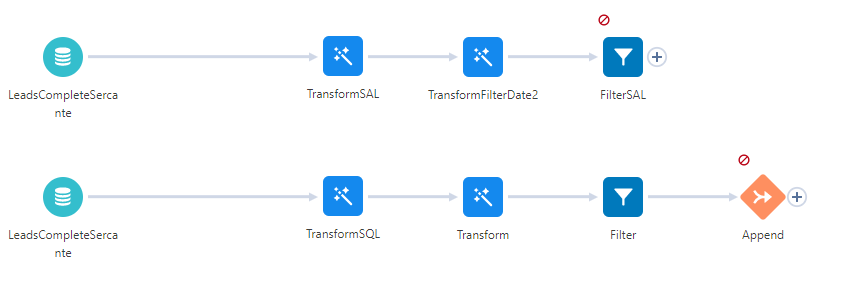
Step 3: Attach a transform to the dataset.
In this next step, you’re going to attach a transform to the dataset. Select the ‘custom formula option.’
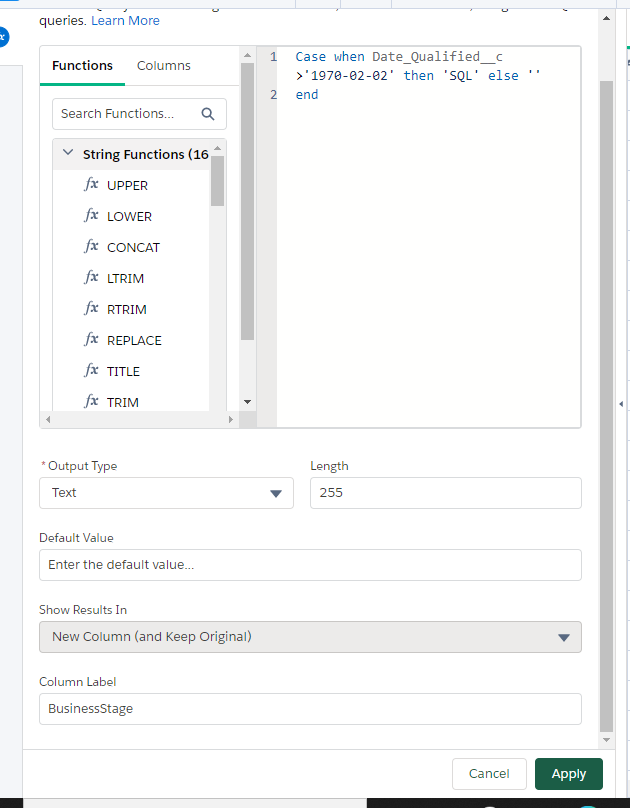
In our example, anywhere the qualified data is after ‘1971-01-01’ we flag the type as MQL, otherwise we leave it blank.
Step 4: Add your rule and create a new field.
Use the “CASE” function to add your rule and create a new field. This will create a new field (BusinessStage) that will indicate ‘MQL’ where the qualified data is valid. Set the field type as text and Make sure to rename the field
Code Sample:
case
when Date_QualifiedMQL__c >’1971-01-01′
then ‘MQL’
else ‘’
end
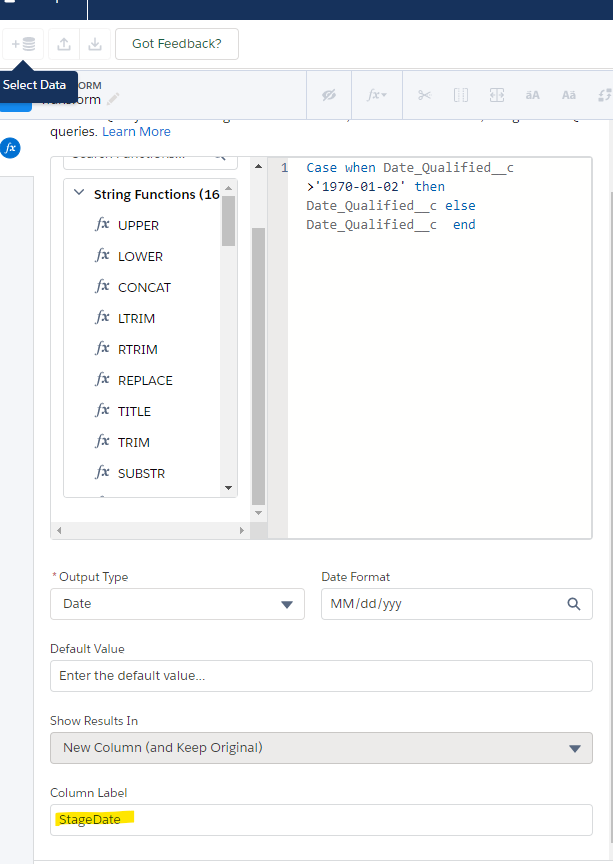
Step 5: Attach another transform.
Attach another transform to populate the correct date using the custom formula. We are essentially creating a date field that will be the “main” date for our dataset and allow the aggregate on the dashboard.
Code Sample:
case
when Date_QualifiedMQL__c >’1971-01-01′
then Date_QualifiedMQL__c
else Date_QualifiedMQL__c
end
Step 6: Add a filter.
Add a filter to whittle your dataset down to just the “MQL” data.

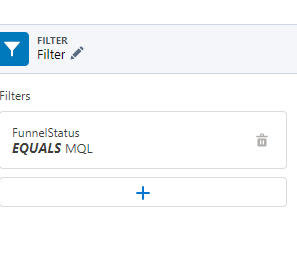
Now your dataset looks like this with “SQL” as a FunnelStatus and the SQL Date as the FunnelDate.
Step 7: Repeat steps 1 through 6.
Repeat steps 1 through 6 to create the next row type. For each, make sure your CASE statement reflects your rules.
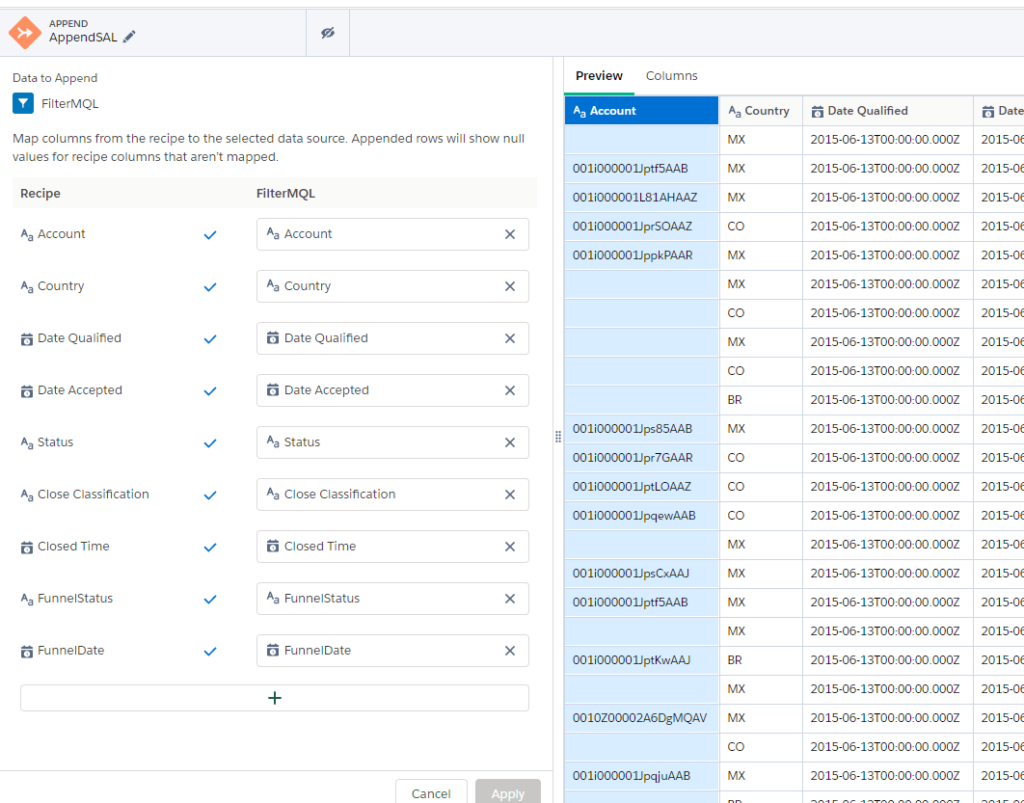
Step 8: Append the dataflows.
Append the two dataflows together with the Append connector. Each dataset must have identical rows to connect them as one (unioned) dataset.
Now your dataset looks like this. Your SALs and MQLs have gone from columns to rows!
For each remaining variable, repeat steps 1-7 with correct transformation rules and add append to the dataset as you go.
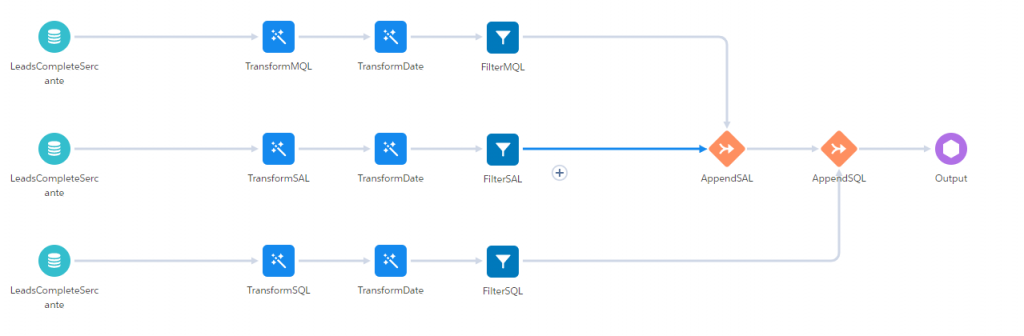
Step 9: Create an output object.
Once you have added all your types in filtered “sub” datasets, create an output object.
Once you run the data flow, you will be able to use the FunnelStage and FunnelDate to do summaries without complex code. If the rules change for creating the FunnelGroups, change the Transforms in the recipe or add new ones.
Now you can use your new dataset to create visuals by date and type or create a summary table.
Further considerations for reformatting Pardot B2BMA data
Here are a few things to keep in mind as you’re getting started.
- You can use joins to add other datasets to your recipe – note they have to exist for all “streams”
- Verify all desired variables have been accounted for (in our example after you filter SQL, SAL and MQL are there rows that are not brought in that you might need in your analysis? )
- You can bring in as many columns as you need for filtering. Since we are turning each “column’ into its own row, each new column can contain the same data it had before, making all filters in the original dataset available.
- Make sure you do a reality check on the data including:
- Expected row counts
- Expected amount totals
- Missing values
- Note that when you create rows from columns, you need to decide if you want ALL data converted or just the data that meets the rules you set. If in doubt, create an additional data stream that filters out all records that don’t meet any of the criteria and make sure to review those. What’s not there might be important too!
Further reading: