Category

Data Management

Get Out of My Dreams Head and Into My Car Diagram

If you’ve ever found yourself singing Billy Ocean songs to yourself as you tried to explain a Data 360 data model using only your hands and a determined facial expression, this post is for you! Data Model Objects (DMOs) and their relationships live in Data 360 in a way that’s technically documented, but not exactly easy to look at. Sure, the Data Model tab gives us some cute bubbles to look at, but it’s not exactly easy to navigate or dive into how individual fields are mapped.
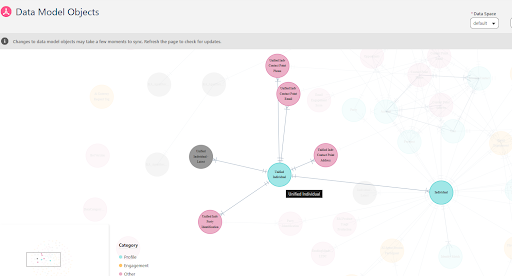
Visualizing data model objects fields

Enter Diagramforce, a free tool for visualizing Salesforce data models as clean, shareable diagrams. The tricky part is getting from the data model from only living in Data 360 (and your head) and into a usable JSON file that Diagramforce can understand. I recently went through this process for a client project and came across several wrong ways to do this before finally landing on a solution. Thankfully it’s one that is easily repeatable and works well as a first CLI project.

Why Use Diagramforce At All?

When I first asked my client if they had any documentation or diagrams showing how each of the DMOs in their system were connected, they pointed me towards the Data Model graph mode, where we quickly discovered that we can’t actually get the type of granular information we’re looking for from that visual. Don’t get me wrong, I do appreciate the high level overview of how each DMO is related to one another, but when I need to get a Data 360 specialist to dive into some field mapping issues with me, it’s not exactly a walk in the park to investigate if you don’t know the data model first hand. 

  • Diagramming existing DMOs and relationships helps with future discovery documentation and knowledge transfers in the event that someone leaves the organization
  • A visual representation of a data model is a lot easier for most people to understand, especially in comparison to a table of object API & field names
  • Seeing your existing data model will help with change management in the future by allowing you to avoid breaking something you didn’t know was connected

Required Tools to Get Started

This should come as no surprise, but there are a few tools and access points that you’ll want to make sure you have before you dive into this project. 

  • Salesforce CLI installed and authenticated to the target org (see below for more information on this process)
  • PowerShell (this walkthrough uses it, but the same logic works in bash if that’s your preference)
  • API access to the org’s DMOs — more on this below

All the Small Wrong Things

Before we dive into the way I made this work, you should know I didn’t get this right on the first or second try. Initially I wanted to retrieve the DMOs as metadata, the same way you’d retrieve a standard component using the CLI. Unfortunately, DataModelObject isn’t a registered metadata type in the CLI registry, so that failed.

Next, I tried to exchange the CLI’s API session token with a Data 360 tenant token, but that didn’t pan out either. The standard CLI session token doesn’t have the right OAuth scope needed for the exchange, and setting up a dedicated Connected App just for a single diagram felt like a lot of overhead for this task.

What Finally Worked

Although you won’t find the DMOs in your standard Object Manager, they are ordinary sObjects under the hood and answer to standard REST API calls the way any standard Salesforce object would. You’ll recognize them by the __dlm suffix. This means we can get to them and their relationships through the regular REST API describe endpoint, using whatever Salesforce org is specified in the CLI. The complete steps for this process are broken down for ease of reference below.

Authenticate Your Salesforce Org

You can connect Salesforce CLI to multiple Developer Orgs, Sandboxes, or Production, each one taking on their own Org Alias. You’re also able to set up a “Default” org that will be used in any commands that do not specify which connected org to use. The commands below will allow you to set an Org Alias, login, and set an org as the default org if desired.

Authentication in Production or Developer Orgs

sf org login web –alias my-org –set-default

Sandbox Authentication Script:

sf org login web –instance-url https://test.salesforce.com –alias my-sandbox –set-default

Edit the my-sandbox or my-org text to set your org alias. Try and keep this something short and memorable, if you add multiple orgs to the CLI you’ll need to reference this pretty regularly. The –set-default tag is optional,  and if you use it this org will be used as the default org when none is specified in a command. 

If your org is using Salesforce Enhanced Domains, you’re able to use the –instance-url command and include the login URL for your Enhanced Domain (checkout the Sandbox Authentication script for an example of this).

Create A Dedicated Folder

We’ll need to point PowerShell to a specific folder to find the scripts we’ll be running in future steps. This folder is also where the scripts will output documentation once they have finished running. Once you’ve created the folder, you’ll need to copy the path from the top of the File Explorer window, as shown below.

Download the Scripts for Extracting and Formatting

This method relies on 2 different scripts, one to extract the data from Data 360, and another to format it appropriately for Diagramforce. You’ll need both of these files stored in the folder you just created in the previous step. Once you’ve downloaded the scripts, you’ll need to replace any of the YourOrgAlias text with whatever org alias you entered when you authenticated the org earlier in this process. Without updating this, the script won’t know where it needs to pull the data from.

View the “Get Data 360 DMOs Script” here

View the “Convert to JSON Script” here.

Set Your Directory in PowerShell

Now that we have our folder created and our scripts saved, we need to tell PowerShell where it should look when we’re executing our next sets of commands. Inside of powershell, type the following:

cd [paste the file path we copied earlier here]

The “cd” command tells the system to change the directory to whatever file path comes afterwards, so for my example, I’d enter:

cd C:\Users\categ\DataCloud Diagrams

Enable Script Execution in PowerShell

By default, PowerShell blocks custom .ps1 scripts so we’ll need to run a command to bypass this restriction. This command only works to bypass things temporarily, so next time you go to run these scripts you’ll need to execute the same command.

Set-ExecutionPolicy -Scope Process -ExecutionPolicy Bypass

Extract DMOs from Data 360

Now that your Salesforce org is authenticated, we’re ready to extract the DMOs from Data 360. Copy and paste the command below, being sure to replace the YourOrgAlias with whatever you set as your org alias in the previous steps.

.\Get-DataCloudDMOs.ps1 -TargetOrg YourOrgAlias

Getting it Ready for Diagramforce

Here’s where I got tripped up the most: you can’t upload the JSON file from the first script into Diagramforce as-is because it’s expecting a specific cell-graph structure. This structure helps to map out shapes with positions and ports, as well as the connections between them, and helps out with layout metadata. Rather than trying to build the structure blind, I was able to reference the JSON spec on Diagramforce’s GitHub and get the right structure for my data. You can run this script in the CLI with the following command:

.\Convert-DMOsToDiagramforce.ps1

This script reads the dmo-model.json stored in the same folder and creates a  diagramforce-import.json file that can be imported into Diagramforce successfully. Head over to Diagramforce and use File > Import JSON to import the diagramforce-import file. Once it’s loaded, you’ll be able to see all of the DMOs in your org, along with the relationships between them. You’ll likely need to spend some time organizing them and cleaning up some of the relationship names, but the end result is an excellent representation of the data model.
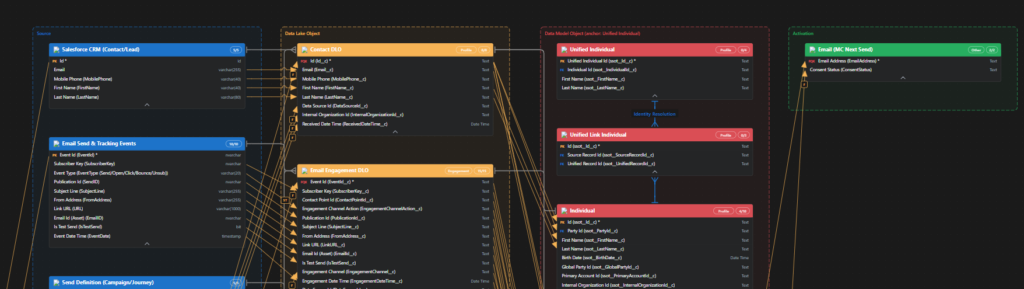
Instructions for converting data models into Diagramforce format

If you get a version mismatch warning on import, double check the appVersion value in the script against whatever the current Diagramforce release expects. You can find this information by checking out the GitHub repository for Diagramforce and checking what the most recent version of the platform is.

GitHub page with notes for Diagramforce

Things to Keep in Mind…

This is absolutely a first pass and not meant to be a finished product, but a step towards more accurate and usable documentation of Data 360. I also fought with 2 different LLMs to figure out the right approach and scripting to get this to work, but the code has been reviewed and this method has been tested in a few different orgs. A few other things worth mentioning:

  • Diagramforce is a great tool, but the layout is still a simple drag and drop grid. You’ll likely need to spend some time rearranging after your import to make sure it’s legible.
  • The scripts here all use “YourOrgAlias” as a placeholder. Make sure to update that text to match whatever your actual Org Alias is prior to running.
  • If your org has multiple data spaces, you will need to filter the DMO list accordingly before converting – otherwise you’ll get a diagram of hot dog fingers everything, everywhere, all at once, defeating the purpose.
  • Relationship names may not be end user friendly as they’re coming directly from the describe call in the script. You may want to relabel a few of them after import for clean documentation.

Another Data 360 Org? Time to Diagram!

If you’re working in Data 360 orgs regularly, it’s worth keeping both scripts (the extractor and the converter) in your toolkit rather than rebuilding them from scratch every time. Run the extractor whenever you land in a new org, run the converter, import into Diagramforce, and you’ve got a shareable diagram in less time than it used to take to attempt explaining the model verbally. Just be sure to update the “YourOrgAlias” name wherever it appears in the script so that it’s pointing to the right Salesforce org at runtime and you’ll be good to go.

Got a cleaner way to handle the layout step, or run into a different Data 360 quirk along the way? Drop it in the comments — I’d love to see how others are tackling this.

If you’ve spent years building Dynamic Lists and Engagement Studio programs, opening Data 360 for the first time can feel overwhelming. Unified Individuals, Segments, Calculated Insights, Data Spaces; it looks like a whole new world. But here’s the thing: it’s not.

At its core, segmentation hasn’t changed. You’re still trying to get the right message to the right person at the right time. What has changed is how much data you have to work with. Instead of building audiences from Prospect records and email engagement alone, Data 360 lets you layer in website activity, CRM data, opportunity history, subscription preferences, and more.

Here’s how to bridge what you already know with what you’ll find in Data 360.

The Biggest Mindset Shift: From Lists to Audiences

In Account Engagement, everything starts with a list.

  • Need a webinar audience? Build a list.
  • Need a re-engagement campaign? Build a list.
  • Need a nurture track? Build a list.

In Data 360, you build reusable audience definitions instead. One segment can power multiple campaigns, journeys, and channels. You’re not creating a new list for every initiative. Think of it this way:

  • Account Engagement: Campaign → Build List → Send Message
  • Data 360: Define Audience → Activate Anywhere

The shift from campaign-specific lists to reusable audiences is the most important concept to internalize before you start building.

Terminology Translation

Before you build anything, here’s the cheat sheet:

Account EngagementData 360 What It Means
ProspectUnified IndividualThe person you’re marketing to
Dynamic ListSegmentA reusable audience built from defined criteria
Dynamic List RulesSegment CriteriaThe logic used to determine audience membership
List MemberSegment MemberSomeone who qualifies for the audience
Prospect ActivityEngagement DataBehavioral data used for targeting
Marketing ListPublished SegmentA ready-to-use audience for activation
Score & GradeAttributesSignals used to identify high-intent audiences

Once that mapping clicks, the platform becomes a lot less intimidating.

Before You Build: Know Your Data

One thing that surprises most Account Engagement users is how much data is available in Data 360. Depending on your setup, you may have access to:

  • Prospect data
  • CRM data
  • Email engagement
  • Forms
  • Landing Pages
  • Website activity
  • Preference center subscriptions
  • Opportunity data
  • External data sources

This is where Data 360 starts to shine.

In Account Engagement, we ask: “Who opened my email in the last 30 days?”

In Data 360, we ask: “Who opened my email in the last 30 days, visited my pricing page, and doesn’t currently have an open opportunity?”

That’s a fundamentally more sophisticated audience, and it’s exactly why organizations are investing in Data 360.

One important caveat: Not every org has the same data sources connected. Before building complex segments, take time to understand what’s actually flowing into Data 360 and how frequently it refreshes. Knowing your data inventory upfront will save you a lot of troubleshooting later.

Building Your First Segment 

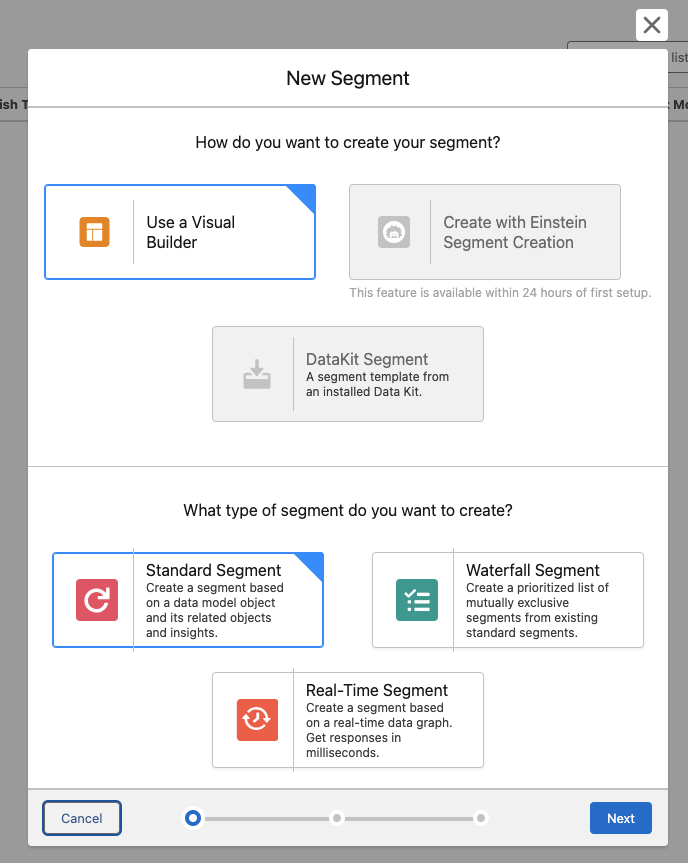
Navigate to Data Cloud > Segments and select New. You’ll see four segment types:

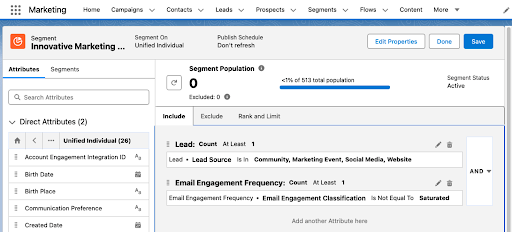
How to build your first segment

Standard Segments are your go-to. These are the closest equivalents to Account Engagement Dynamic Lists and support the vast majority of marketing use cases. Start here.

Waterfall Segments let you prioritize audiences and prevent contacts from qualifying for multiple competing campaigns simultaneously — useful when running multiple offers at once.

Real-Time Segments evaluate audiences on demand for use cases requiring immediate qualification. Powerful, but they come with limitations.

Once you’ve selected Standard Segment, there are four ways to build your audience.

Option 1: Use the Visual Builder 

The Visual Builder offers the most flexibility and is where most marketers spend the majority of their time. The process is straightforward:

  1. Create a New Segment
  2. Select your Data Space (most often your Default Data Space)
  3. Choose the object you want to segment on (most often Unified Individual)
Using the Visual Builder when creating a new segment
  1. Name your Segment
  2. Configure your publishing settings
  3. Drag attributes onto the canvas and define your criteria
  4. Save and publish

Understanding Direct Attributes vs. Related Attributes

This is one of the biggest mindset shifts for Account Engagement users.

When building criteria in the Visual Builder, you’ll typically see two types of attributes:

Direct Attributes

Direct Attributes live directly on the object you’re segmenting against.

For example, if you’re building a segment on the Unified Individual object, direct attributes might include:

  • First Name
  • Last Name
  • Country
  • State
  • Preferred Language

Think of these as fields that belong directly to the person.

Example: Country = United States

This is a simple, direct attribute filter.

Related Attributes

Related Attributes come from connected objects that are related to the object you’re segmenting on.

Examples include:

  • Email engagement activity
  • Opportunities
  • Campaign Membership
  • Website activity
  • Orders
  • Cases

Think of these as records associated with the person rather than fields that live directly on the person.

Example: Opened an email in the last 30 days

The email open isn’t stored directly on the Unified Individual record. It’s stored on a related engagement object.

When Should You Use Each?

A simple rule:

  • Use Direct Attributes when filtering on profile or demographic information.
  • Use Related Attributes when filtering on behavior, engagement, transactions, or relationships.

If you’re asking “Who is this person?” you’re usually looking at Direct Attributes.

If you’re asking “What has this person done?” you’re usually looking at Related Attributes.

Understanding that distinction makes segment building much easier and helps explain why some criteria appear in different areas of the builder.

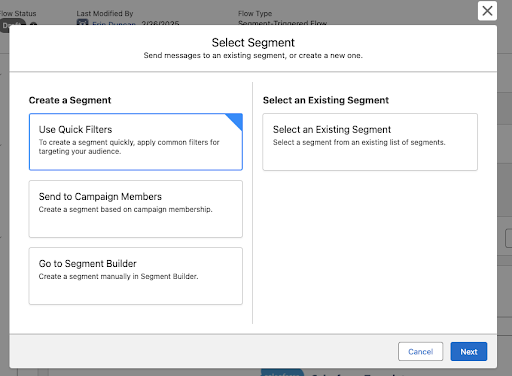
Option 2: Use Quick Filters 

Need a common audience fast? Quick Filters offer predefined criteria for standard scenarios like:

  • New Contacts created today
  • New Leads created today
  • Recent Campaign Members
  • Contacts related to a won Opportunity

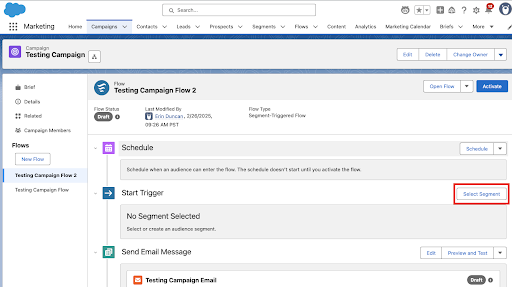
Access Quick Filters by navigating to Campaign while in the Marketing Cloud Next app. Open a campaign and select Select Segment. It’s a great starting point if you’re brand new to the platform.

Accessing quick filters by going to Campaign
Once in campaign select "Select Segment."

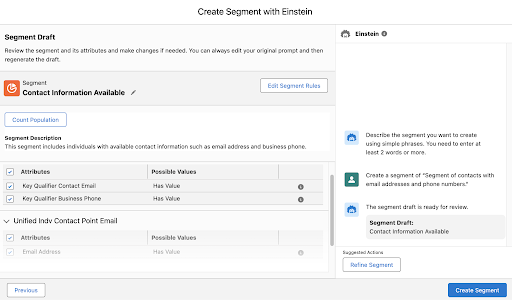
Option 3: Use Einstein to Build a Draft 

Not sure where to begin? Einstein Segment Creation lets you describe the audience you want in plain language:

How to build a draft using Einstein Segment Creation

Show me subscribers who opened an email in the last 30 days, visited our pricing page, and are subscribed to product updates. 

Einstein generates a draft segment you can review, refine, and publish. Think of it as a shortcut to a first draft and always validate the output before going live.

Option 4: Use a Dynamic Segment

If you find yourself creating the same types of audiences repeatedly, Dynamic Builders can help streamline the process. Instead of starting from scratch each time, Dynamic Builders let you create reusable audience templates with configurable criteria. Marketers can then generate new segments from those templates by simply selecting or updating a few values, helping ensure consistency across campaigns while reducing manual effort. They’re especially useful for organizations with standardized audience definitions or recurring segmentation needs, allowing teams to scale segmentation without rebuilding the same logic over and over.

Which option should you choose? If you’re just getting started, use Quick Filters for common audiences or the Visual Builder for custom logic. Einstein Segment Creation is a great way to generate a first draft from natural language, while Dynamic Builders are best when your organization wants to standardize and reuse the same audience patterns across multiple campaigns.

Tips, Gotchas, and Things I Tell Every Client

Use the IN Operator Instead of Stacking OR Conditions

If your CRM has multiple versions of the same value, the IN operator saves you a lot of time. Instead of building three separate OR conditions, write: 

Country IN (USA, US, United States)

It supports up to 100 values. Clean, readable, and much easier to maintain.

Understand Measurements, Operators, and Values

When working with behavioral data, Data 360 often asks you to combine three pieces:

  • Measurement
  • Operator
  • Value

For example: Email Opens → Count → At Least → 1

This translates to: “The person has opened at least one email.”

Another example: Email Clicks → Count → Greater Than → 5

This translates to: “The person has clicked more than five emails.”

Think of it like a sentence: Measurement + Operator + Value = Audience Rule

Examples:

  • Count At Least 1
  • Count Equals 0
  • Sum Greater Than 1000
  • Count Between 5 and 10

If a segment returns unexpected results, this combination is often the first place I investigate. The measurement may be correct, but the operator or value may not align with the business requirement.

Use Include and Exclude Intentionally

One of the most common mistakes I see is placing all data requirements into the “Include” section. Instead, think of Include as those who belong and Exclude as those who don’t belong. Separating those concepts creates cleaner segments and makes troubleshooting much easier.

Include Criteria: Country IN (USA, US, United States)

Exclude Criteria: Emailed in the last 3 days

Use EQUALS When Your Data Is Clean

When a field is standardized, and you only need one exact match, EQUALS is the right call. Country EQUALS USA will only return records where the value is exactly “USA.” No flexibility, but that’s the point.

Build Frequency and Recency Into Your Logic

This is where Data 360 starts to feel genuinely different from Account Engagement. You can filter by:

  • Has been emailed X times in the last Y days is great for suppression. If someone has received 3 emails in the last 7 days, you probably don’t want to send them a fourth.
  • Has not engaged in X days is your re-engagement and deliverability workhorse. Use it to identify lapsed subscribers before they become a problem.
  • Subscribed to [Preference] will build audiences based on what contacts have explicitly opted into. Increasingly important for compliance and deliverability.

Always Preview Before You Publish

Segment Preview lets you check audience size, sample records, and whether your include/exclude logic is working as intended. A few minutes here can save hours of troubleshooting later.

Account for Processing Time

Data 360 isn’t always instantaneous. Initial data ingestion can take days, depending on volume. Segment calculations take time and Dynamic Lists connected to a Data 360 Segment can take up to three hours to populate the first time. If nothing shows up immediately, give it time before assuming something is broken.

Not All Account Engagement Activity Is Automatically Available

A common misconception: not every historical activity flows into Data 360 by default. What’s available depends on your connector configuration and the Filter By Date you set when connecting. Before building complex engagement-based segments, confirm what data is actually being ingested.

Data 360 Doesn’t Honor CRM Visibility Rules

This one surprises many Salesforce Admins. Users can segment records in Data 360 that they can’t see in the CRM. If access control matters for your org, address it before rolling out segmentation broadly. The most reliable controls are user permissions and Business Units.

From Segment to Activation

One of the biggest misconceptions I encounter: adopting Data 360 means abandoning Account Engagement. It doesn’t. One of my favorite use cases is building sophisticated audiences in Data 360 and activating them directly through Account Engagement via the Data 360 Connector. To connect a Data 360 Segment to Account Engagement:

  1. Navigate to Account Engagement → Segmentation → Lists
  2. Create a Dynamic List
  3. Select Data Cloud Segment as the Dynamic List Type
  4. Choose your published segment

The first sync takes up to three hours. After that, membership updates automatically whenever the segment refreshes. Once connected, the Dynamic List works anywhere in Account Engagement, including Engagement Studio, Automation Rules, List Emails, Completion Actions, and Reporting. Data 360 identifies the audience. Account Engagement engages it. That’s where the value compounds.

Three Segments to Build First

Not sure where to start? These three are worth building in almost every org.

Recently Engaged Contacts: people actively interacting with your brand. Use for webinar invitations, product launches, or newsletters.

  • Opened an email in the last 30 days, OR
  • Clicked an email in the last 30 days, OR
  • Visited your website in the last 30 days

Inactive Subscribers (90+ Days): Subscribers who’ve gone quiet. Use for re-engagement campaigns, deliverability cleanup, or preference center outreach. This audience frequently surfaces new pipeline.

  • Opted in, AND
  • No opens in 90 days, OR
  • No clicks in 90 days

Preference Center Subscribers: Contacts who’ve told you exactly what they want. Use for targeted newsletters, product announcements, or event promotions.

  • Opt in to Product Updates

Data 360 segmentation isn’t replacing the skills you’ve built in Account Engagement; it’s extending them. You’re still defining criteria, building audiences, and activating campaigns. The difference is you now have richer data and more ways to use it. Start simple. Build a Quick Filter segment, get comfortable with the interface, then move into the Visual Builder. Before long, you’ll stop asking how to recreate Dynamic Lists and start asking what was possible all along.

Several data breaches affecting a wide range of companies that use Salesforce have been reported in recent weeks. These incidents have impacted organizations across various sectors, including technology, retail, and insurance. The exposed data has varied by victim but has commonly included customer contact information, internal business records, and even sensitive data like API tokens and credentials.

Sercante clients can be assured that our systems have not been impacted by these recent attacks, however we want to make sure that Salesforce customers are aware of these incidents and are equipped to safeguard their instances.

How the Breaches Occurred

The recent breaches are not due to a vulnerability within the Salesforce Core platform itself. Instead, threat actors have used sophisticated social engineering and supply chain attacks to gain unauthorized access. 

One common method has been targeted voice phishing (vishing) campaigns. In these attacks, bad actors impersonated legitimate employees or IT support staff to trick victims into downloading a malicious replica of Data Loader and granting access to their Salesforce environments.

In a recent and widespread campaign, attackers leveraged compromised OAuth tokens for a third-party application, Salesloft Drift. By exploiting the integration between the app and Salesforce, the threat actors were able to export large volumes of data and credentials from numerous corporate Salesforce instances in what is called a “supply-chain attack”. . The attackers were able to steal “digital keys,” or authentication tokens, from the Drift app. They then used these stolen keys to access and steal data and credentials like passwords, API keys, and access tokens for other services that could be used to compromise other systems integrated with Salesforce.  

This highlights a critical risk: while the core platform may be secure, its connections to third-party apps can introduce vulnerabilities.

Risk to Salesforce Customers

The primary risk to Salesforce customers lies in the potential for stolen data to be used for further attacks. Customer contact information and other details can be weaponized in targeted and highly convincing phishing and social engineering campaigns to gain access to other corporate systems. The exposure of sensitive information like API tokens and credentials poses a significant threat, as it can be used to compromise connected systems, such as other cloud platforms or internal networks.

UPDATE: If you are a Drift customer – Salesloft has announced plans to shut down its Drift chatbot following their recent security breaches. This no doubt presents a challenge to your website engagement strategy.  The Sercante team is well-versed in the various conversational platforms that integrate seamlessly with Salesforce and can help you navigate this transition.

Recommended Actions for Protection

While Salesforce has taken steps to restrict the use of “uninstalled connected apps”, customers should take steps to protect themselves from similar threats:

  • Reauthenticate Drift Connections: Salesloft Drift customers will need to reauthenticate their Salesforce integration with Drift. It’s also advised that any and all authentication tokens stored in or connected to the Drift platform should be considered potentially compromised and update them immediately. 
  • Rotate all credentials and keys: Immediately change any passwords, API keys, and other access tokens that were stored in your Salesforce instance
  • Investigate your Salesforce account: Look for any unusual activity in your Salesforce login history, audit trails, and API access logs from early to mid-August 2025. Look for suspicious logins or data access patterns, particularly from the user account associated with the Drift integration.
  • Audit Third-Party Apps: Audit your connected apps to make sure they are secure, and make sure that all third-party apps connected to your Salesforce account have only the minimum permissions they need to do their job and revoke access for any app that is no longer in use.
  • Secure APIs and Integrations: When configuring new integrations, restrict API access by defining trusted IP ranges and ensuring that connected apps have the most restrictive scope possible.
  • Apply the Principle of Least Privilege: Limit user permissions to only what is necessary for their job role. Restrict administrative access and minimize the use of permissions like “Modify All Data.”
  • Be on high alert for phishing: Warn your employees to be extra cautious about any unexpected or unusual emails, phone calls, or messages. The attackers may use the stolen contact information to try and trick people into giving up more sensitive data.
  • Rinse & Repeat: Security isn’t a set it and forget it function. It takes constant and consistent vigilance to protect your systems and data. 

While the core Salesforce platform is secure, recent data breaches are a reminder that a company’s security is only as strong as its weakest link, which is often a third-party app or a human being. To stay safe, you have to be proactive. By using strong security practices, enforcing strict access rules, and training your team, you can drastically improve your defenses. Ultimately, keeping your data safe is a team effort—you, Salesforce, and all of your employees have a role to play.

If you’d like a guide to help you navigate how to optimize data protection in your organization with Salesforce, reach out to the Sercante team. Our experts can be your guide for impactful next steps.

Student retention is one of the most pressing challenges in higher education—and it’s not just about keeping enrollment numbers up. It’s about making sure students feel supported, connected, and confident in their ability to succeed, and engaging them before it’s too late.

Almost a quarter, 22.3%, of first-time, full-time undergraduate freshmen drop out within the first 12 months, while 39% don’t complete their degree within eight years (Education Data Initiative). 

Which is why it is imperative for institutions to be taking action to improve student retention. One of the ways they can is by maximizing the technology they have and tapping into the latest solutions available to gain a better view of their students’ journeys and take action to engage when it matters most.

In Sercante’s latest demo, we explored how Salesforce’s connected tech stack—featuring Data Cloud, Marketing Cloud Advanced, and Agentforce can empower institutions to identify and support at-risk students before they fall through the cracks.

In the demo, we followed the journey of Jason Smith, a sophomore whose profile revealed a 77% attrition risk. What followed is a case study in how smarter tech, working harder behind the scenes, can drive real results for both teams and students.

Unifying Student Data for Smarter Insights

Everything begins with data. Using Salesforce Data Cloud, we created a Unified Student Profile by integrating key data sources across systems: academic performance, course engagement, attendance patterns, and more.

This holistic view powered a propensity model that flagged Jason’s risk level at 77%. Instead of relying on gut instinct or outdated reports, the team now had real-time, actionable insight—and a clear signal that it was time to act.

A screenshot of Jason Smith's student profile showing the attrition risk at 77%.

From Insight to Action with Marketing Cloud Advanced

That’s where Marketing Cloud Advanced comes in. Once a student is identified as at-risk, every minute matters. This tool enabled us to build automated, personalized communication journeys, so students like Jason could receive the right message at the right time.

Jason’s message came from Sercante University: a friendly, timely nudge to connect with an advisor. And because it was based on real-time data from his unified profile, it felt relevant, not random.

A Seamless Path to Support with Agentforce

The magic moment? When Jason clicked the link and landed on a scheduling page powered by Agentforce.

Here’s where tech meets empathy. Agentforce’s AI assistant recognized Jason’s concerns about unavailable classes and provided instant, personalized guidance—helping him book an appointment with an advisor in just three clicks or less.

No back-and-forth emails. No waiting. No frustration. Just a frictionless experience that made Jason feel seen, supported, and empowered to move forward.

A Multi-Cloud Solution that Improves Student Retention

What made this work wasn’t just the data or automation—it was how these tools worked together to create a better experience for both students and staff.

  • For teams: The heavy lifting was handled behind the scenes. With Data Cloud pulling real-time insights, MC Advanced automating outreach, and Agentforce handling the scheduling, advisors could spend less time triaging and more time supporting.
  • For students: It felt easy, human, and personalized. Jason didn’t need to fight for support—it found him, right when he needed it. He got help fast, with minimal effort and instant gratification.

This Agentforce, Data Cloud, and Marketing Cloud Advanced, multi-cloud solution, is an example of when teams use the power of data and AI to engage their students when it matters most, before it’s too late. Intercepting more students like Jason can help institutions improve student retention while creating real connections that last to drive growth for the institution and in Jason’s educational journey.

Final Takeaway

When schools bring together data, automation, and AI, they unlock a more connected, proactive, and student-centered approach to retention.

  • Students feel seen, supported, and confident in what to do next
  • Teams get relief from manual processes and can focus on what matters most
  • Institutions see better outcomes—without burning out their staff

It’s not just about reducing attrition—it’s about building trust, creating moments that matter, and delivering an experience that helps every student thrive.

Want to see the full journey? Watch the demo here

Looking to implement something similar at your institution? Reach out to the Sercante team.

Product Note: Marketing Cloud Growth and Advanced are editions of Marketing Cloud Next and have also been referred to as Agentforce Marketing.

Marketing Cloud Growth/Advanced (aka Next Gen Marketing Cloud) is built to leverage the power of Data Cloud, giving marketers key benefits like unified customer profiles, enhanced segmentation, cross-object personalization, and calculated insights. However, these capabilities come with a cost in the form of Data Cloud credit consumption. In this post, we’ll review several tips to help you maximize the benefits of Data Cloud without breaking the bank.

Introduction to Data Cloud Credits

Before we start talking about conserving credits, let’s take a look at what they are and what actions use them.

What Are Data Cloud Credits?

Salesforce defines Data Cloud Credits as “digital currency that you use to pay for Data Cloud services.” These credits are consumption-based, meaning you only pay for what you use. Use a little, pay a little. Use a lot, pay a lot. 

Credit use is calculated by multiplying the number of units consumed for each usage type by the corresponding multiplier from the rate card. Usage types include Data Services, Data Storage, Einstein Requests, and Segment Activations. Usage can be monitored in the Digital Wallet included in your Salesforce org.

The key takeaway is that credits are a valuable resource, and every action comes with a related cost. The goal is not to scare marketers or discourage credit usage. It’s to encourage smart, intentional use to ensure that each credit delivers value.

Here are some great resources if you would like to learn more about these topics.

Tips for Optimizing Your Data Cloud Credit Usage

Tip #1 – Apply Filters to Data Streams

Identity resolution rules are one of the largest consumers of Data Cloud credits. They use Data Service credits to create the unified individual records required for Marketing Cloud Growth/Advanced. This process is essential and must be activated. But it can be optimized.

Save Credits with Filters 

Identity resolution rules link data from multiple data sources into unified individual records. Credit consumption is based on the total number of records that Data Cloud reviews when unifying the records. Credits can be conserved by applying filters to the data streams to limit the number of records being used in the identity resolution process.

Example:

If your lead data stream contains 1M records and your contact data stream includes 500K records, 1.5M records will be used in the creation of the unified individual records. Data filters can be applied to limit the number of records used in the identity resolution process by focusing on only records that should be included in your marketing activities.

Applying Data Filters 

Data filters can be applied in two ways:

  1. When Ingesting: By adding a filter to the data streams
  2. After Ingestion: By applying a filter to the data lake object (DLO) in the data space (Marketing Cloud uses the default data space)


The filters will impact the system processes like unification, segmentation, and CI, but will not impact the total number in the data stream.

Example:
There are 6,088 total records in the lead data stream (and let’s say that 2,500 are from the USA). If you apply a filter for Country = USA, the total record count in the data stream stays the same (6,088), but only the 2,500 records from the USA will be used in system processes (including identity resolution).  This reduces the data being evaluated to only leads in the USA and will reduce credit consumption.

A screenshot of recently viewed data streams in Data Cloud.
A screenshot in Data Cloud showing how to edit the filter in a data stream to only include records whose country equals USA.


The great thing about filters is that they help save credits across multiple areas. They reduce credit usage in identity resolution and also limit the number of records evaluated in processes like segmentation and calculated insights. This saves you even more.

Tip #2 – Audit Refresh Schedules

Credits are consumed when data is refreshed in Data Cloud. This includes data streams, data graphs, calculated insights, identity resolution rules, and segments. 

Data Streams
Data streams based on Salesforce data refresh every 15 minutes by default and upsert with new or changed records. Manual updates can also be triggered if needed. Data ingested from other sources can be scheduled to run hourly or daily, so it’s worth taking a look at their schedules.

If you find the data is being refreshed hourly, consider the frequency that the data is actually updating (in the data source being ingested) and the “freshness” that’s needed in your marketing activities. Hourly refreshes make sense for data that changes frequently and is used in time-sensitive communications. In other cases, daily refreshes might meet your business needs and they would save credits.

Data Graphs
Data graphs are used for personalization and dynamic content, and refresh daily by default. The refresh interval can be updated by navigating to the data graph in Data Cloud and selecting the “Schedule” option from the dropdown (under the ▼icon).

More frequent refresh intervals mean “fresher” data, but will use more credits. I recommend sticking with the daily refresh option and adjusting based on your needs. Remember, manual refreshes can also be triggered if needed.

A screenshot of the Refresh Interval drop down setting to set your Data Graph's refresh schedule.

Identity Resolution
Identity Resolution rules run daily and the schedule can’t be changed. The rules will run once every 24 hours and the time of day might vary based on your org and the amount of data being processed. Manual refreshes can be triggered by navigating to the rule and clicking the “Run Ruleset” button.

The only real optimization for identity resolution is limiting the number of records processed (by applying filters) as discussed in the first tip.

Segments
Segment refresh schedules are the primary way that marketing teams can reduce Data Cloud credit consumption. When creating a segment, the Standard Publish option offers the following refresh schedules:

  • Don’t refresh
  • 12 hours
  • 24 hours


I recommend choosing “Don’t refresh” unless there’s a defined need to refresh more frequently. This ensures segments aren’t needlessly refreshing—and burning credits unnecessarily.

Make sure your segments are still up to date before sending emails by selecting the “Immediately before running this flow” refresh option in your segment-triggered flow. This guarantees your email targets the most current segment population, without incurring extra credit usage from scheduled refreshes.

A screenshot showing toggling on "Immediately before running this flow" for the setting for "When do you want to republish this segment?"

Tip #3 – Be Selective

Data storage is another factor to consider when evaluating credit consumption. When ingesting data into Data Cloud, start with a minimalist mindset. Ask yourself the following questions when deciding which fields to include:

  • Is this field needed for identity resolution?
  • Is this field needed to support marketing efforts (ex. dynamic content, personalization, segmentation)?
  • Is this field used in calculated insights?

If the answer to these questions is “no,” hold off on ingesting the field to reduce unnecessary data storage. If a new use case arises later, the field can always be added to the data stream.

How to add a field to an existing data stream 

  1. Confirm the Data Cloud Salesforce Connector has read access to the field.
    • Permission Sets > Data Cloud Salesforce Connector > Object Settings
      • Navigate to the object that contains the field and verify the “Read Access” box is checked
  2. In Data Cloud, select the Data Streams tab and the data stream related to the object where the field is located.
  3. Click the “Add Source Fields” button from the selected data stream.
  4. Select the field (or fields) from the table and save.
  5. Click the “Review” button in the Data Mapping section and map the fields from the data lake object to the data model object (you might need to create new custom fields).

Make the Most of Your Credits 

Data Cloud credits are a valuable resource and should be managed accordingly. With a little bit of planning and some regular audits, you can make the most of your credits and take full advantage of the AI, calculated insights, personalization, and segmentation capabilities of Marketing Cloud Growth/Advanced.

If you have questions about Data Cloud or Marketing Cloud Growth/Advanced reach out to the Sercante team or leave us a comment. 

Product Note: Marketing Cloud Growth and Advanced are editions of Marketing Cloud Next and have also been referred to as Agentforce Marketing.

Marketing Cloud Growth and Advanced Edition (aka Marketing Cloud on Core or just Marketing Cloud) offers incredible capabilities to marketers in so many areas. From AI powered segmentation, scheduling and sending SMS in a nurture campaign, and unprecedented abilities to tailor your marketing content to the audience viewing it, Marketing Cloud Growth and Advanced Edition can help marketing teams large and small automate their marketing efforts. All of these amazing capabilities rely on the power of one key feature of Data Cloud – the Data Graph

Data Graphs allow you to combine and transform data from multiple Data Cloud Data Model Objects (DMOs) into a single view. This read-only Data Graph can then be used in a variety of ways through API, automations, and Salesforce applications, like Marketing Cloud. In fact, a Data Graph is a requirement for using personalization (and some automations) within Marketing Cloud – the objects and fields you select when creating this graph are the same objects and fields that you’ll have access to when adding personalization to your marketing content or powering your automations. 

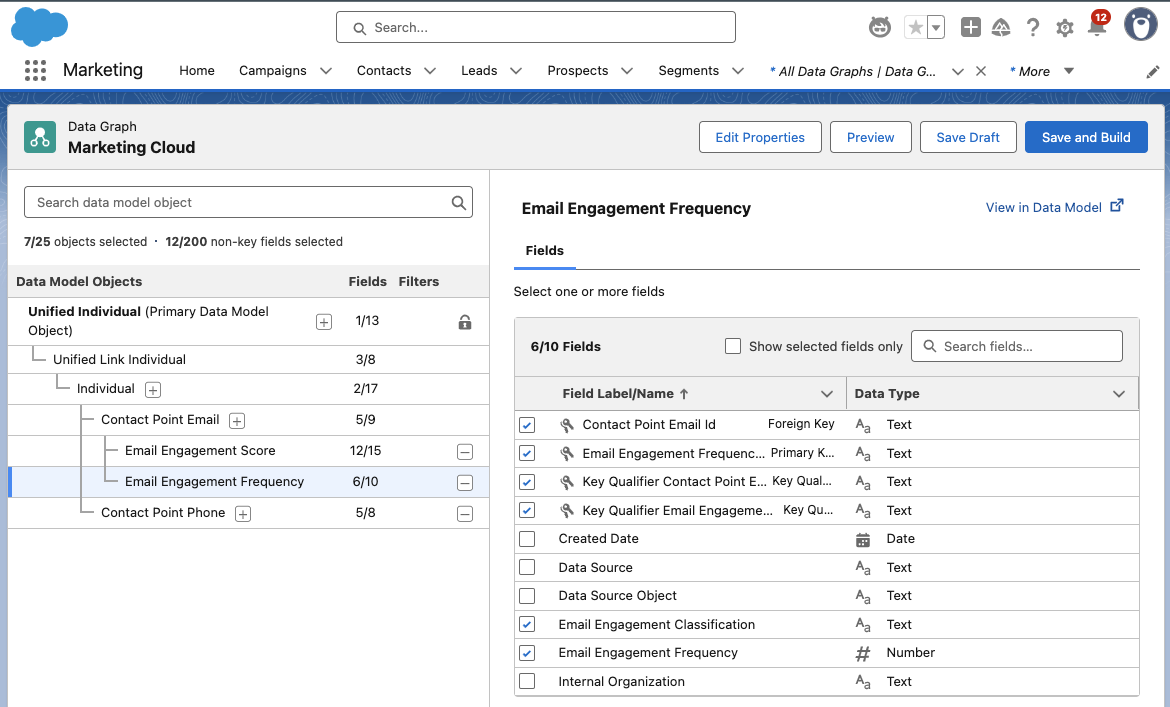
Your Data Graph needs to have a specific shape to successfully send your emails. If you have Marketing Cloud Advanced Edition, you’ll also need to ensure that Einstein Engagement Scoring and Einstein Engagement Frequency features have been enabled before building. This blog will help you understand the steps needed to take to create and edit your Data Graph for Marketing Cloud.

Things to Consider Before Building a Data Graph

Once upon a time editing a data graph wasn’t possible, which meant gathering all of the information you’d need to reference in your marketing efforts before building your first graph. Now it’s entirely possible to edit your data graph, but I’d still highly recommend you gather your requirements ahead of time, so let’s think about what you’ll need.

What fields do you need for personalization?

Personalized marketing content is the name of the game, so the first thing to consider is what fields you’ll want to reference in any personalized marketing content. This should include things like First Name, Last Name, Title, and Account but you should also consider what custom fields you may want to reference, like the name of a product or webinar they’ve attended.

Are there any fields you’ll need for segmentation?

The segmentation capabilities in Marketing Cloud rely on the fields that are included in your data graph, so next up it’s time to think about how you’re planning on segmenting your prospects for email, SMS, and/or WhatsApp sends and automations. Common things to include could be industry, region, and address data. Make note of the fields and the object that those fields are on. For example, if you want to pull in industry, that field is likely on the Account Object. Keep in mind that anything you include here must have some relationship to the individual included in the segment. 

What will you need for your automations?

The last thing you’ll need to consider is any information you might need for your flows. What information will you be basing your automation decisions on? Things to consider include campaign membership or status, email engagement, and geographical information.

Have Advanced edition? Turn on Einstein Features (if applicable)

Marketing Cloud Advanced Edition includes Einstein Engagement Scoring and Einstein Engagement Frequency. Be sure to enable these features before building your data graph! 

Confirm the fields are in Data Cloud

Now that you have your field requirements determined, the next step is to make sure all these fields are mapped to your Data Streams. These field mappings take the new information ingested in the data stream and map it to the appropriate fields and objects in the Data Model Object (DMO) to create or update the appropriate records. Head to the Data Streams tab in Data Cloud and confirm all the fields you listed earlier are mapped to the appropriate DMOs. Check out this help article for some data mapping best practices.

Be sure the Data Cloud Connector can View All fields

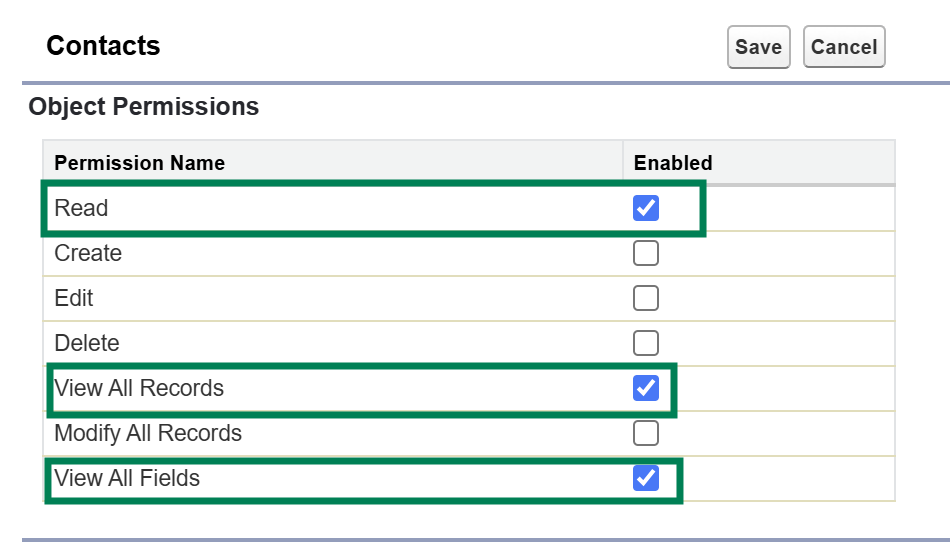
One of Salesforce’s core tenets is trust, and that extends across all layers of the Salesforce ecosystem. This means that the connector between Data Cloud and Sales Cloud has minimum access to information in your Salesforce system. Make sure all the fields you’re including in your data graph are visible to Data Cloud by going to the Data Cloud Salesforce Connector Permission Set and updating the object settings to include the View All and Read permissions for every object you’ve listed. This ensures that all objects and fields are able to be ingested into Data Cloud.

Building the Standard Data Graph for Marketing Cloud 

We have a step by step blog on building a data graph for personalization, but as a quick refresher, here are the steps you’ll need to take and things to keep in mind. 

  1. Go to Salesforce Setup > Marketing Cloud > Assisted Setup > Reporting and Optimization > Customer Engagement
  2. Click on “Go to Data Graphs”
  3. Create a new data graph from scratch
  4. Use the default data space
  5. Select the Unified Individual as your Primary Data Model Object
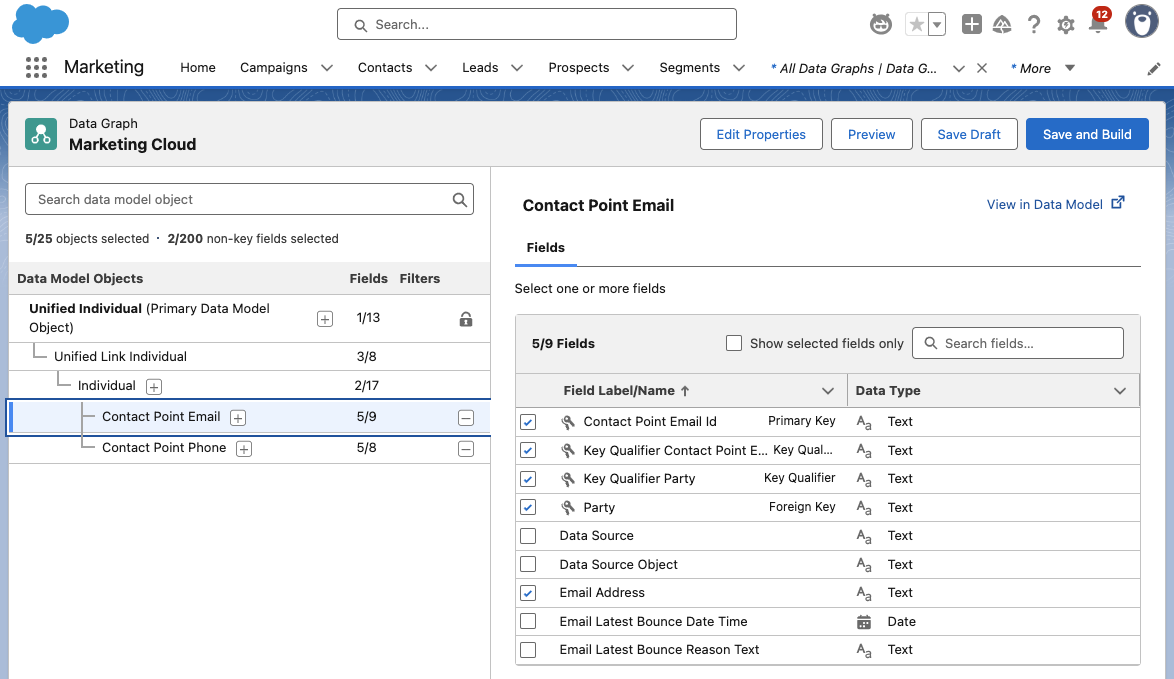
  6. Ensure your data graph has the following shape:
  • Unified Individual (Primary Data Model Object)
    • Unified Link Individual
      • Individual
        • Contact Point Email
        • Contact Point Phone
  1. Make sure all the objects and fields on your lists are included in the data graph
    1. The following fields must be selected during the Data Graph setup:
      1. Individual ID from ‘Individual’
      2. Email Address from ‘Contact Point Email’
      3. Telephone Number from ‘Contact Point Phone’

But what if you have Advanced?

If you’re using Marketing Cloud Advanced Edition, be sure to include the Email Engagement Score (Unified Individual > Unified Link Individual > Contact Point Email) and Email Engagement Frequency (Contact Point Email & Contact Point Phone). 

Add in SMS 

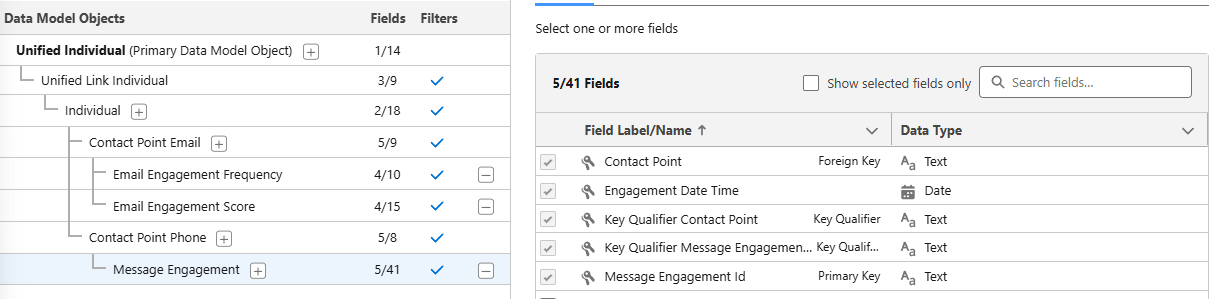
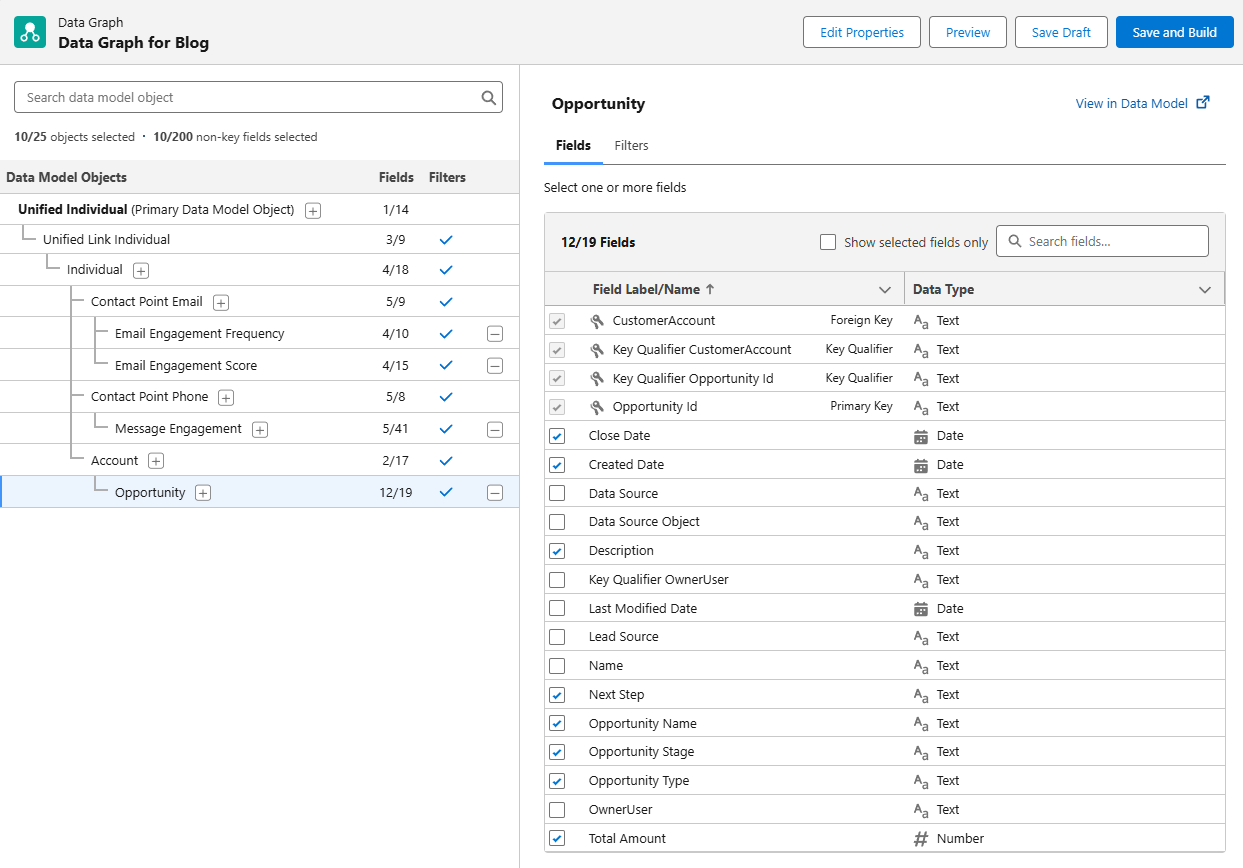
By now, your data graph should look something like this, give or take the Email Engagement Score, Email Engagement Frequency, and SMS options. To include SMS in your Data Graph, be sure to include the Contact Point Phone and the Message Engagement options, as shown below.

Message Engagement gives you lots of options for monitoring how your SMS marketing is doing. Use this to monitor engagement with your SMS messages, the messages you’re sending, links, subscription information and more!

Bringing in Custom Fields and Objects

Okay, so we’ve covered adding in all the standard objects and fields you’ll need for your standard personalization and automation needs, but what about the custom objects that you may have in your organization? These may be objects from integrations, or ones you’ve created to help manage campaigns or customer orders. 

To bring this information into your Data Graph for use in your marketing, you’ll need to ensure that there’s a connection to the Individual in some manner. What does that mean? An easy example is an Opportunity – Opportunities are connected to the Individual via their Account in Salesforce. Select the top level item in your Data Graph, then use the + option to drill down to the object you’re looking for. Once you’ve gotten your object added on the graph, use the right side of the screen to select the fields you want to include in the graph.

Deploy Your Data Graph

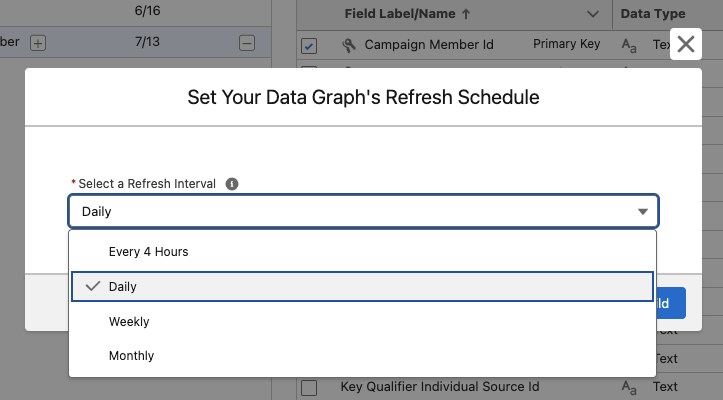
Now that you’ve built your graph, the next step is to save and build, then deploy your graph. Click on Save and Build then choose your refresh interval. Keep in mind that every refresh will consume credits! The right refresh interval will depend on how you’re planning on using the Data Graph, but typically the daily refresh rate works well for marketing needs.

Head Back to Setup to Deploy Your Graph

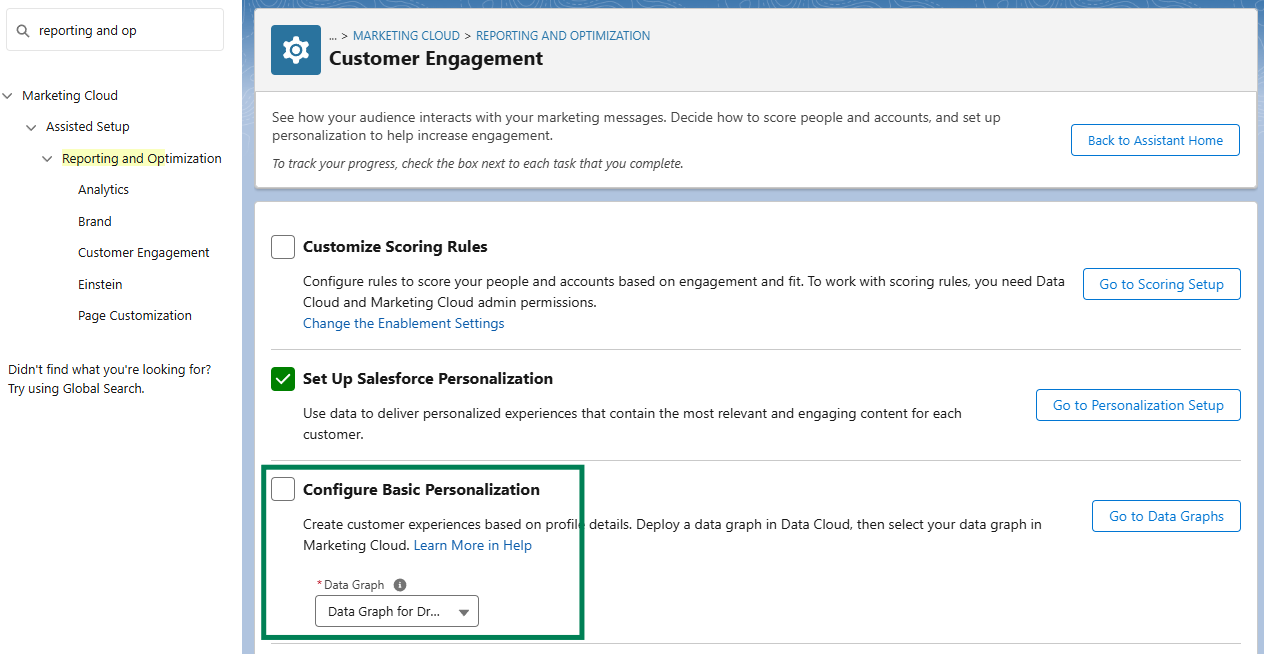
From Salesforce Setup, type Reporting and Optimization in the Quick Find box and navigate to the Customer Engagement option. In the Configure Basic Personalization section, use the drop down menu to select the Data Graph you just created.

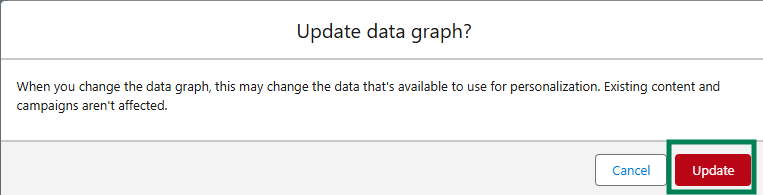
If prompted, confirm that you want to update your data graph by clicking the Update button.

Get Personalizing with Your Data Graph!

Now that you’ve built and deployed your Data Graph, you’re able to use the information in your personalization and automation efforts across Marketing Cloud. This powerful tool combines information from across your Salesforce organization into a single place of reference for Marketing Cloud to use that will update automatically on a planned schedule.

No more posts to show