
Ever wonder how you can optimize real estate in your Salesforce CRM Analytics (formerly Tableau) dashboard? A great option is using toggles.
There are several types of toggles. You can select a single field from a dataset when you have the values in one field. Or, you can create a custom toggle that lets you change views and other attributes dynamically.
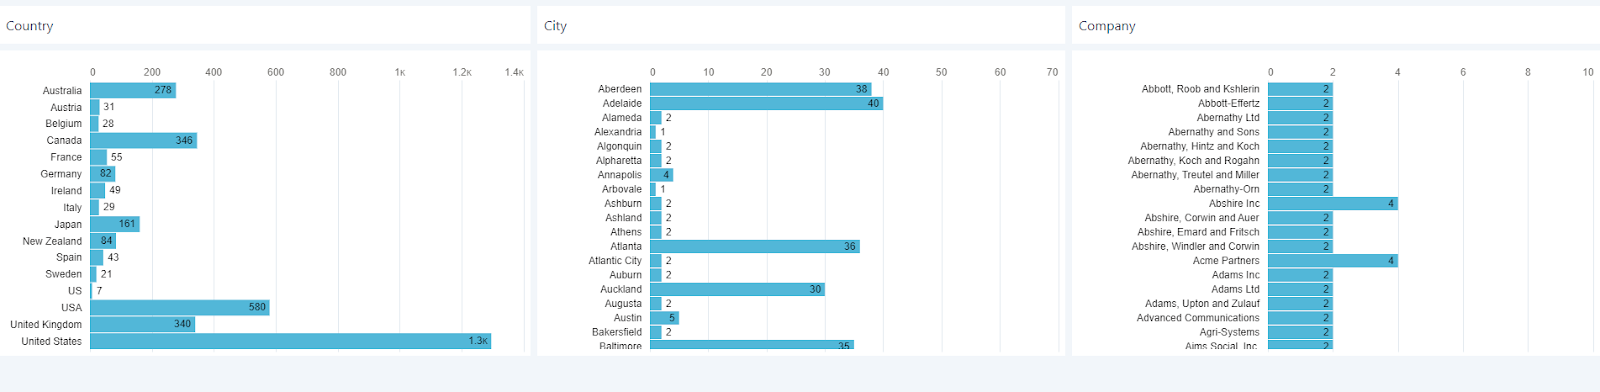
You can go from this:
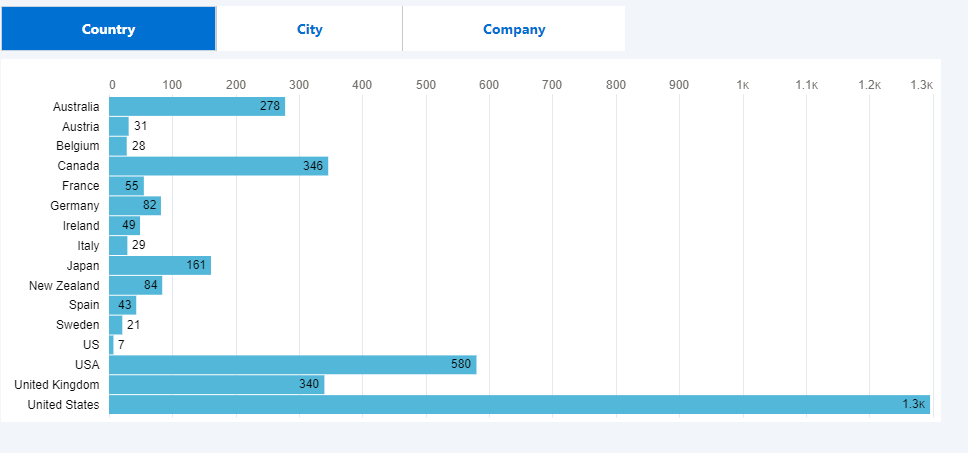
To this:
What is a toggle?
A toggle is a widget that lets you quickly jump from view to view and show your dashboard users what their options are. You can use them to change groupings, column names and even metrics used.
In this example, we will keep it simple.
Step 1: Create the visual.
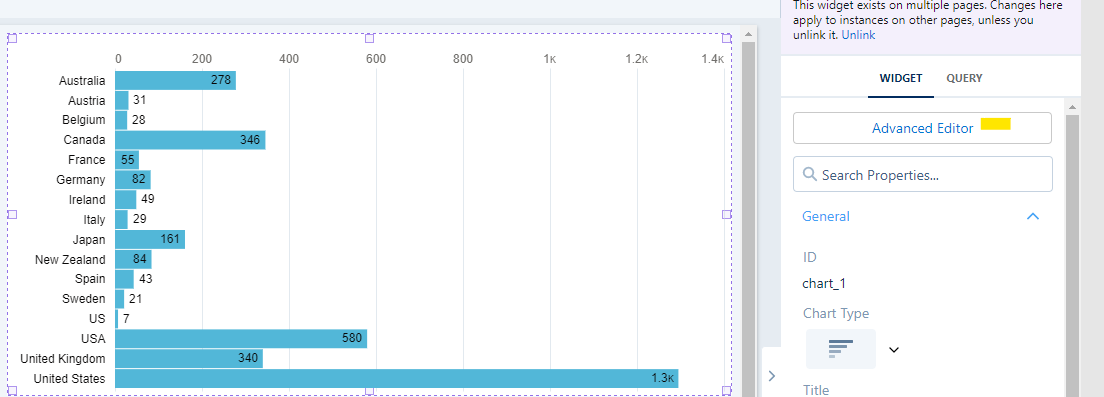
In our example, we are using the Pardot Prospects dataset. We drag a chart filter onto the Canvas and group by Country.

Step 2: Create the CRM Analytics (Tableau) toggle.
Next, we drag a toggle widget onto the canvas. With your toggle on the canvas, you’ll:
1. Click on the toggle.
2. Select “Change data source” (top right).
3. Select “Create Custom Query” (bottom left).

4. Add a name for the column (the name will display in the toggle).
5. Select “+ Add Column” and select “Dimension.”

6. Select the “Pardot Prospects” Dataset.
7. Add Country.
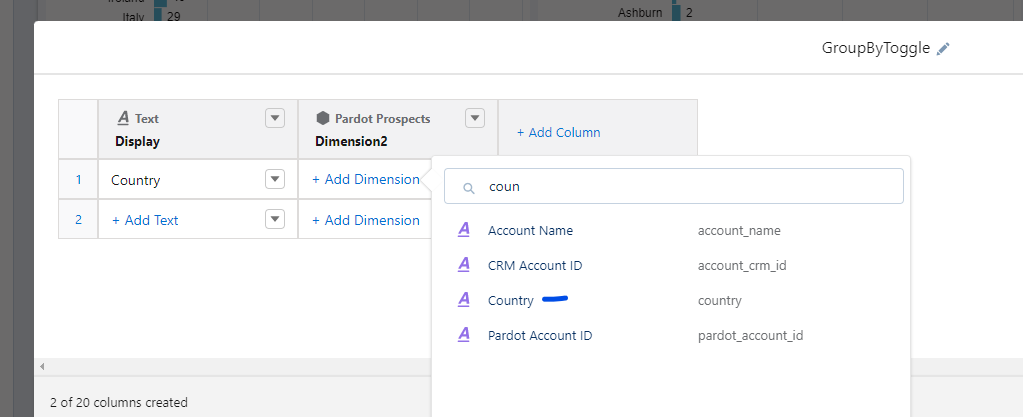
8. Repeat for all dimensions you want to use. Click “Done.”
9. Click on the toggle and change the query properties to “Single Selection (required).” 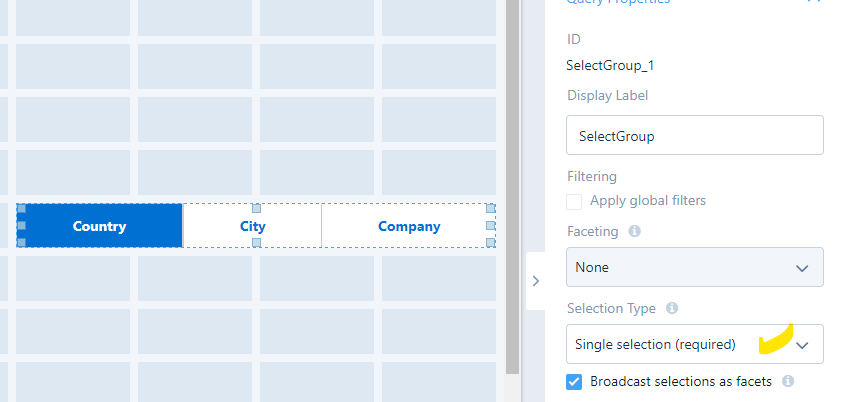
Step 3: Bind the toggle.
1. Click on the chart you created earlier and select “Advanced Editor” in the right-hand panel.
2. Click on “Select Query” on the left-hand side.
3. Select the name of the Toggle you created (In this case, it’s “Select Group”).

4. Select the Back arrow by choosing a query to return to the main screen.
5. Under “Source Data” click on “Choose data.”

6. Use the dropdowns to select “column” and select the column with the Dimensions you selected. Use the back arrow next to “Select Data” to return to the main screen
7. Change the interaction type to “selection” and the “Data Serialization Functions” to “asObject”
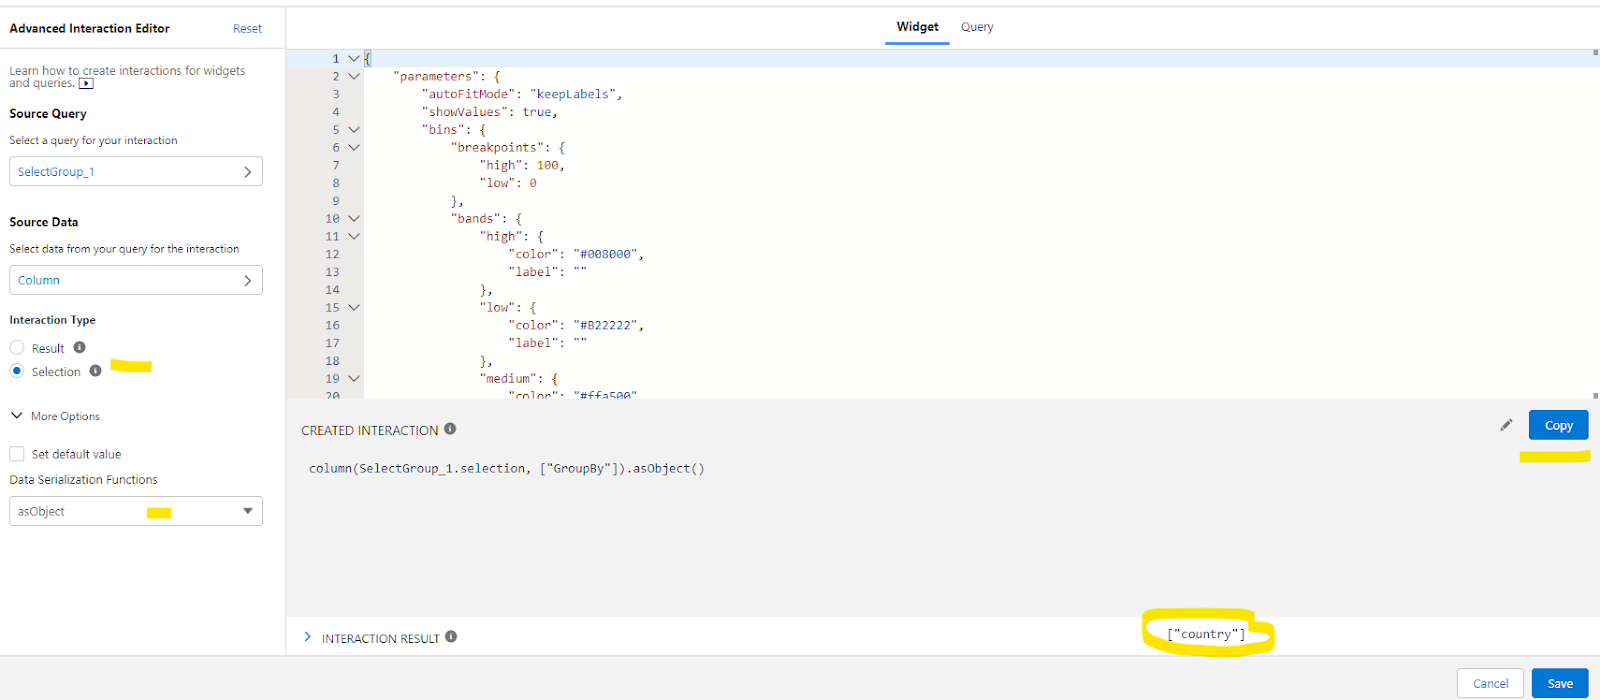
Note that the Interaction result shows you the value that is created by your string. Click on the “Copy” button to save the interaction code to your clipboard
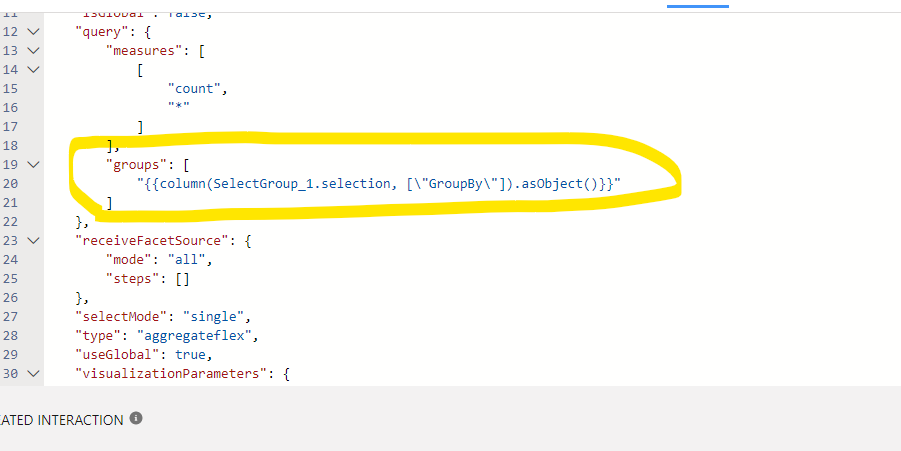
8. Find the “groups” area and replace the “Country” group with the code you just created (see below). Make sure you keep the Quotes on each side.
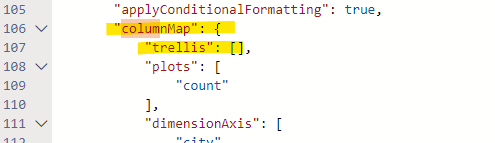
9. Click on the “Widget” Link at the top. Use the Find function to find the “column map” section.
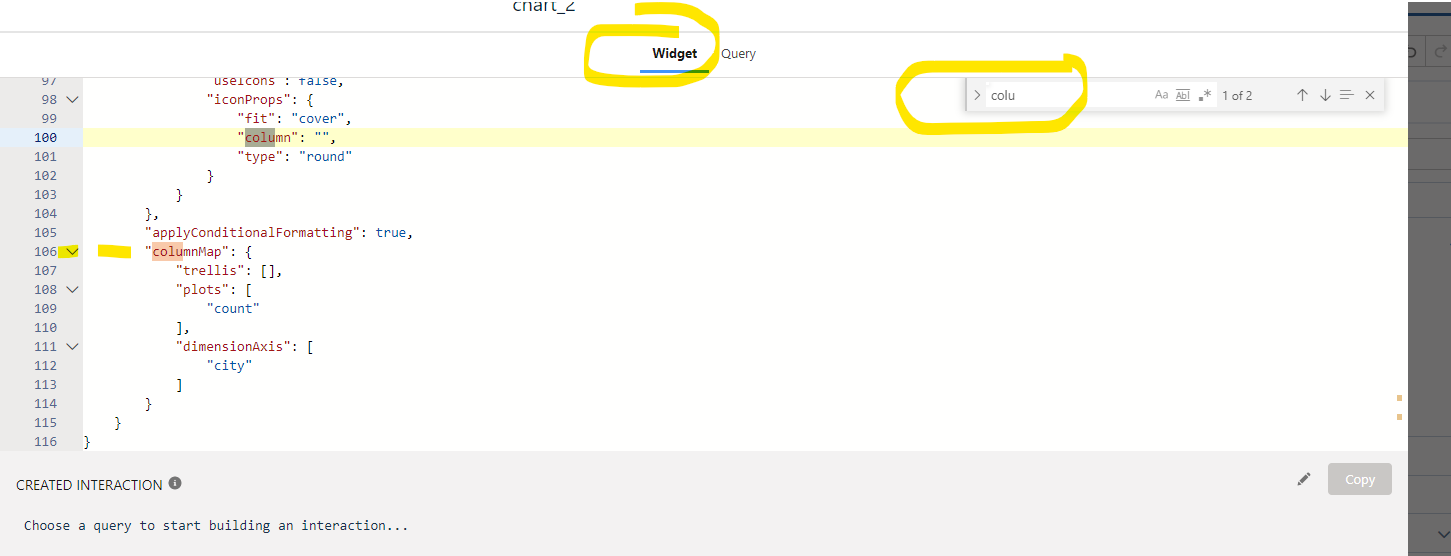
10. Change the value from this:
To this:
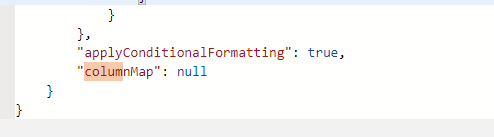
Why do we need to remove the column map?
We remove the column map because we are dictating with our Binding what the columns will be and removing Tableau CRM’s static mappings.
Happy toggling with Tableau CRM!
That’s it! You can now use the toggle to select any of the views you created.
As you play around with this feature, you can get very fancy. You can use bindings to change just about anything in your chart dynamically.
When you’re finished playing around, here’s another solution you can use to customize your Tableau CRM reporting tables and keep it going.
Happy toggling!
How fancy are you gonna get with your custom toggling in Tableau? Tell us about it in the comments or send us a message to chat.