Category

Dominique Beaudin

The Salesforce Summer ‘22 Release is sending lots of love to CRM Analytics (formerly Tableau CRM) users in the form of updates and new features that make reporting work easier using the tool.

These are the features we’re going to start using ASAP.

What CRM Analytics features are there to love in the Salesforce Summer ‘22 Release?

They said it was coming. They said it would be here soon. Now it’s here. The CRM Analytics data manager has gotten a facelift and some groovy new features. 

Flows are headed out the door. Hello recipe driven data sets! Will you be ready? 

Read ahead to find out how some of these new features will change the way you use CRM Analytics

Reviewing Usage of CRM Analytics limits

Viewing usage is now a breeze! No more wondering what the limits are or how close you are to reaching them. This usage is unique to what’s used by CRM Analytics. I’ve been using this feature since the beta so I can’t even remember how we did it before.

All recipes, all the recipes, all the time (well pretty soon)

The retirement of flows is imminent. No, they won’t disappear, but this release shows that a strong “nudge” is being given to moving away from Data Flow (happy dance on my part).

Side note: the Flow to Recipe conversion (Beta) does not appear to be ready for primetime and flows are not going anywhere any time too soon! 

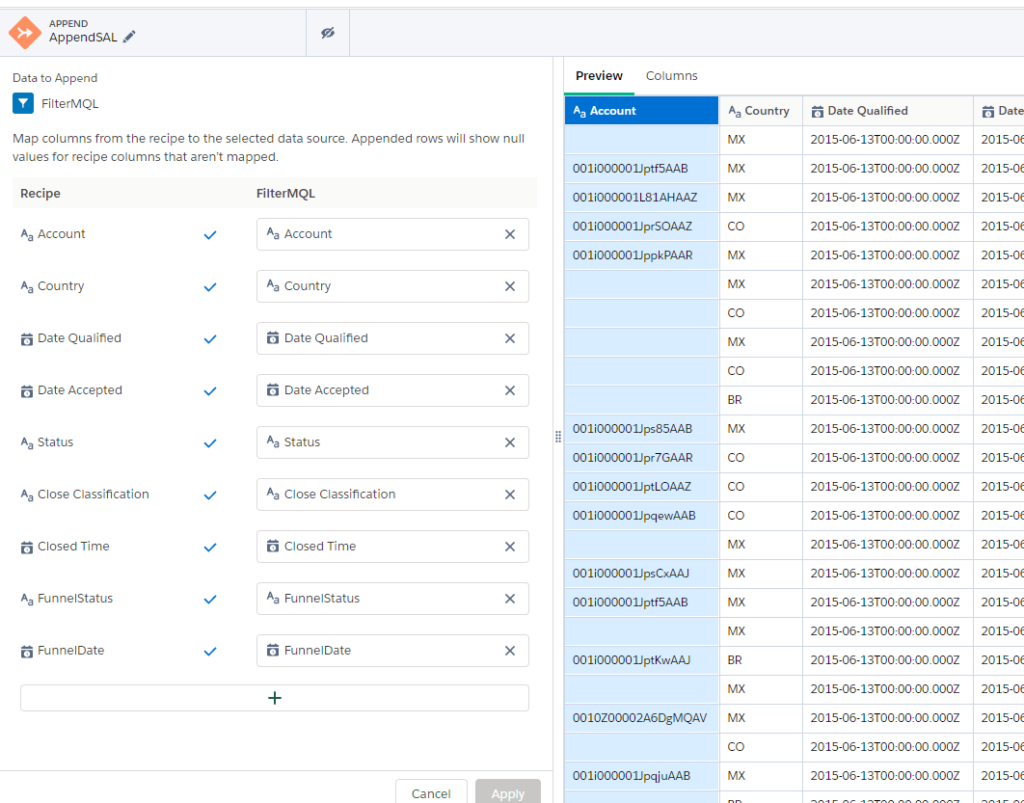
As part of this transformation, new Recipe features are being released to close the gap.

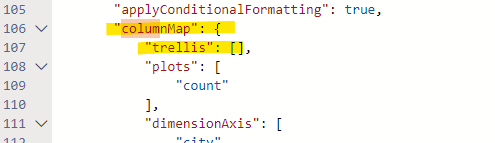
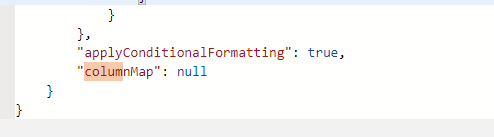
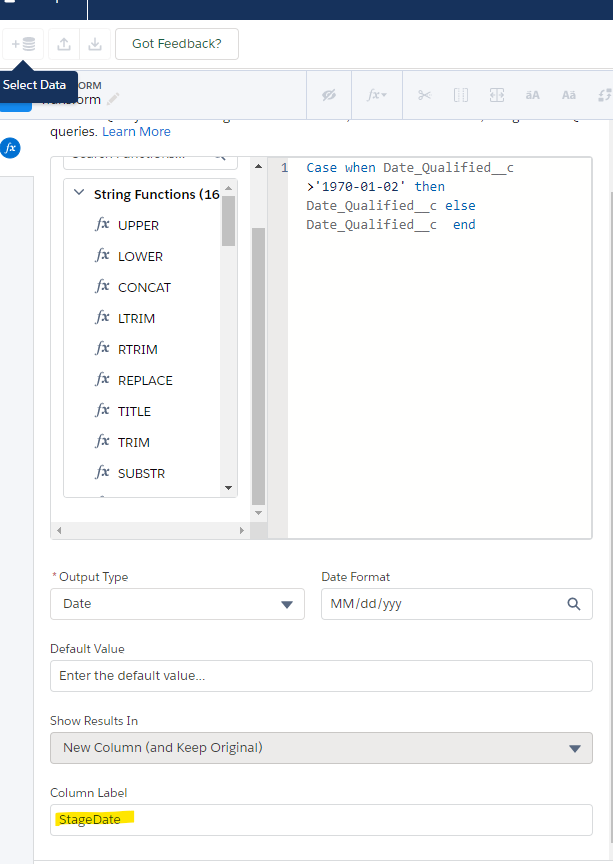
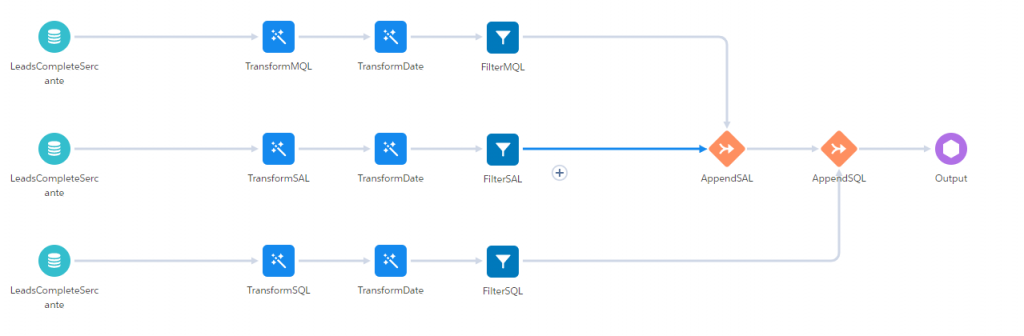
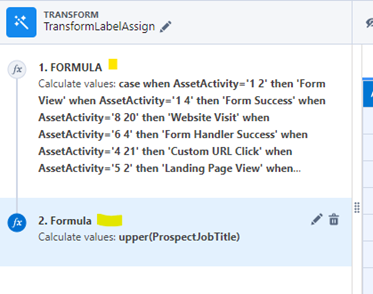
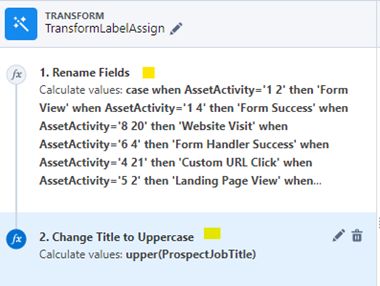
You now can give each step in a transform a name in a recipe

Before
After

Salesforce resource

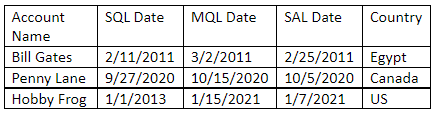
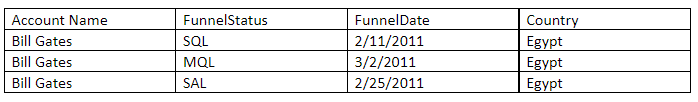
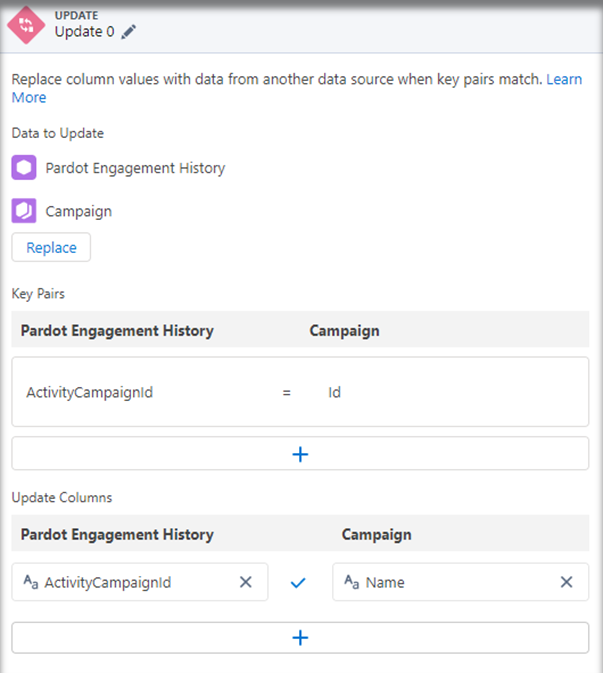
The “update” Join is now out of beta! 

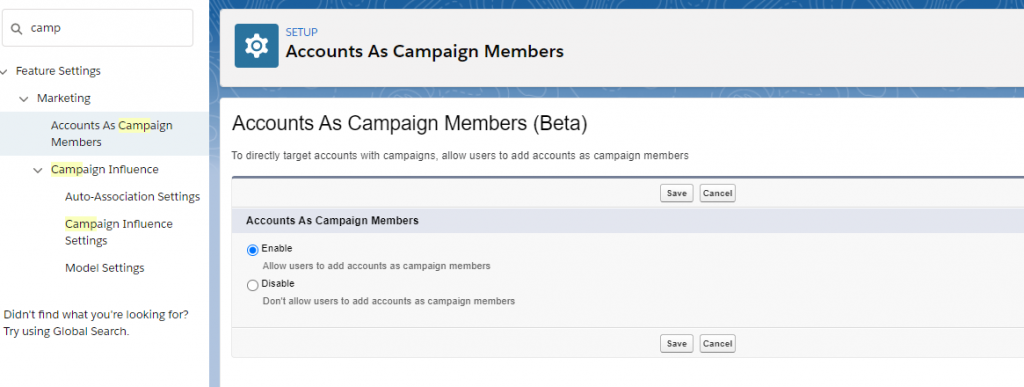
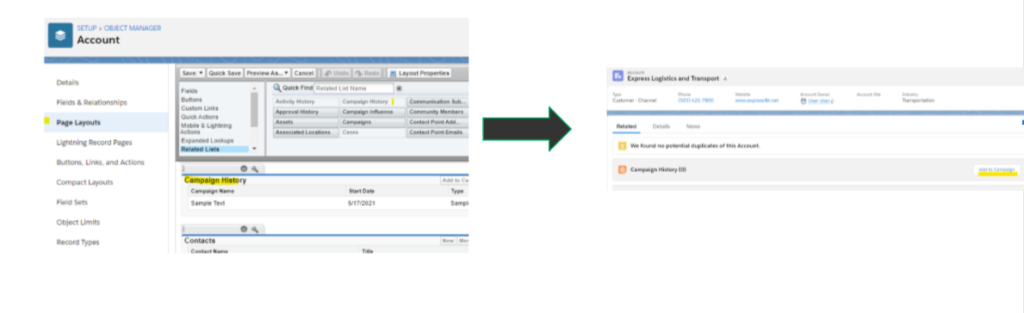
Use Case: The update can be used to replace fields with those from another table. For example, instead of joining and adding a bunch of fields, you can update the Campaign name directly in related objects — less complexity and mess! 

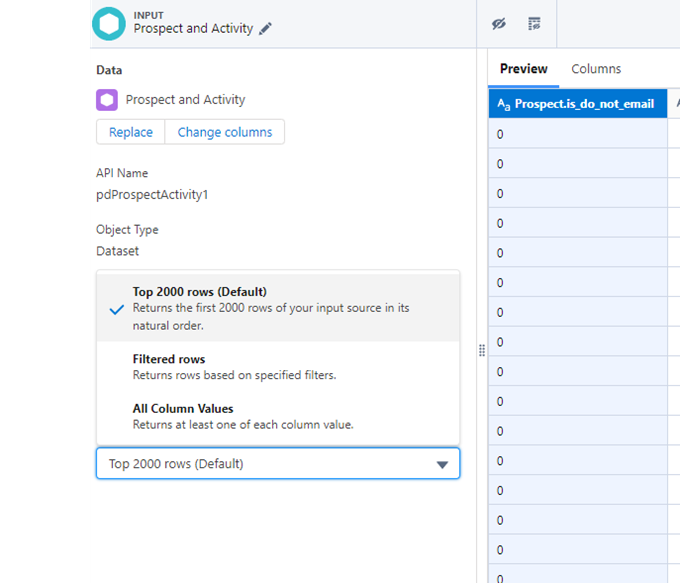
Improved Data Sampling in Recipes

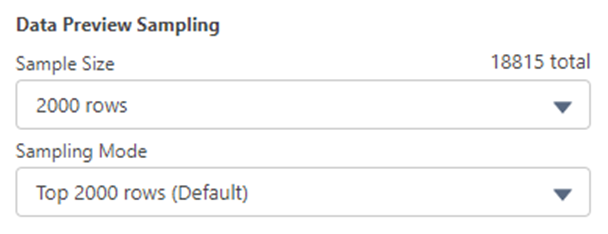
Select how you want the preview to work! 

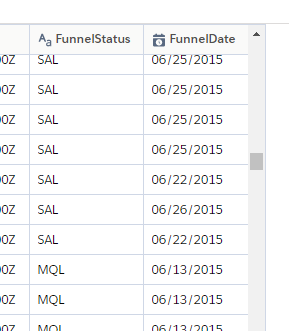
You can now select a “sampling mode.” This is REALLY useful when the results you want to see might not exist in the initial rows returned (like when you are selecting filters). No more guessing when bucketing and filtering your values!

Salesforce resource

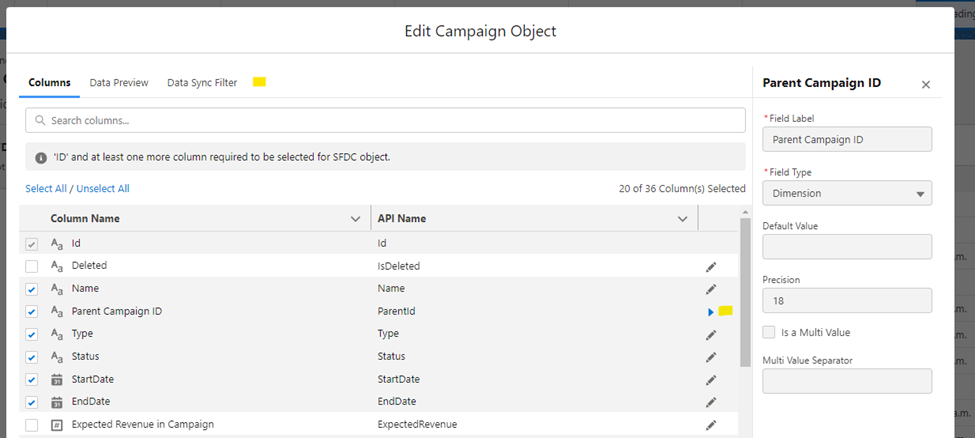
Connections screen that connects with your needs 

The connections area now has a simpler layout. That means seeing what’s available for use has never been easier. You can also view filters, multi values and other specific information about your connected data sources in one screen. 

When selecting connectors (add connector) you can now pick the type easily and see what options are available (and the list is growing). Open any object to see the new streamlined layout!

Improved Data Manager Layout

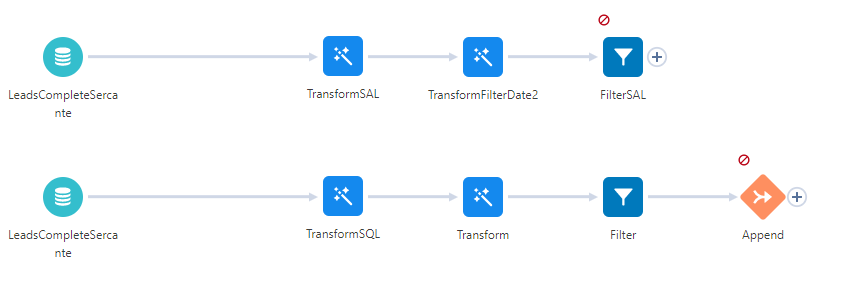
 It’s now super easy to see what’s happening, happened or will happen!

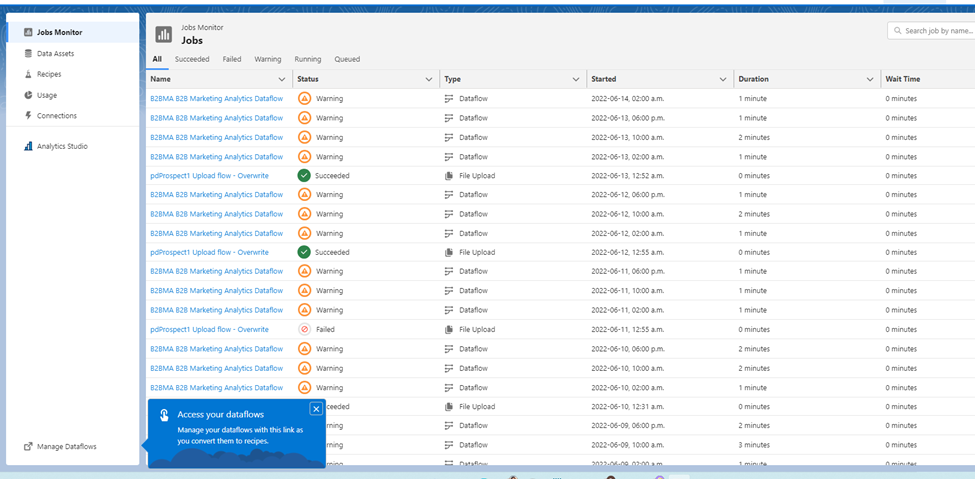
And finally, a small but wonderful change…. The status “circle” in Data manager now actually means something. The “green” shows how much of the recipe/dataflow has run so you can have some idea of how far into the process your data generation has gone!

Salesforce resource

See all the possibilities in CRM Analytics 

Maybe one of the most compelling things about the changes has nothing to do with what you can do, but with what you can now easily SEE. With all the possibilities becoming more visible, I anticipate many CRM Analytics admins and users digging into more of what the product has to offer.

Let us know what you’re working on in the comments section or reach out to us here.

Happy reporting everyone! 

Further Reading

Ever wonder how you can optimize real estate in your Salesforce CRM Analytics (formerly Tableau) dashboard? A great option is using toggles. 

There are several types of toggles. You can select a single field from a dataset when you have the values in one field. Or, you can create a custom toggle that lets you change views and other attributes dynamically. 

You can go from this:

Graphical user interface, application

Description automatically generated

To this:

Graphical user interface, application, table, Excel

Description automatically generated

What is a toggle?

A toggle is a widget that lets you quickly jump from view to view and show your dashboard users what their options are. You can use them to change groupings, column names and even metrics used. 

In this example, we will keep it simple.

Step 1: Create the visual.

In our example, we are using the Pardot Prospects dataset. We drag a chart filter onto the Canvas and group by Country.

Chart, bar chart

Description automatically generated

Step 2: Create the CRM Analytics (Tableau) toggle.

Next, we drag a toggle widget onto the canvas. With your toggle on the canvas, you’ll:

1. Click on the toggle.

2. Select “Change data source” (top right).

3. Select “Create Custom Query” (bottom left).

Graphical user interface, application

Description automatically generated

4. Add a name for the column (the name will display in the toggle).

5. Select “+ Add Column” and select “Dimension.”

Graphical user interface, application

Description automatically generated

6. Select the “Pardot Prospects” Dataset.

7. Add Country.

Graphical user interface, application

Description automatically generated

8. Repeat for all dimensions you want to use. Click “Done.”

9. Click on the toggle and change the query properties to “Single Selection (required).” Application

Description automatically generated with medium confidence

Step 3: Bind the toggle.

1. Click on the chart you created earlier and select “Advanced Editor” in the right-hand panel.

Graphical user interface, application

Description automatically generated

2. Click on “Select Query” on the left-hand side.

3. Select the name of the Toggle you created (In this case, it’s “Select Group”).

Graphical user interface, text, application

Description automatically generated

4. Select the Back arrow by choosing a query to return to the main screen.

5. Under “Source Data” click on “Choose data.”

Graphical user interface, application

Description automatically generated

6. Use the dropdowns to select “column” and select the column with the Dimensions you selected. Use the back arrow next to “Select Data” to return to the main screen

7. Change the interaction type to “selection” and the “Data Serialization Functions” to “asObject”

Graphical user interface, application

Description automatically generated

Note that the Interaction result shows you the value that is created by your string. Click on the “Copy” button to save the interaction code to your clipboard

8. Find the “groups” area and replace the “Country” group with the code you just created (see below). Make sure you keep the Quotes on each side.

Graphical user interface, text, application

Description automatically generated

9. Click on the “Widget” Link at the top. Use the Find function to find the “column map” section.

Graphical user interface, text, application, email

Description automatically generated

10. Change the value from this:

A picture containing chart

Description automatically generated

To this:

Graphical user interface, application, Word

Description automatically generated

Why do we need to remove the column map?

We remove the column map because we are dictating with our Binding what the columns will be and removing Tableau CRM’s static mappings.

Happy toggling with Tableau CRM!

That’s it! You can now use the toggle to select any of the views you created.

As you play around with this feature, you can get very fancy. You can use bindings to change just about anything in your chart dynamically.

When you’re finished playing around, here’s another solution you can use to customize your Tableau CRM reporting tables and keep it going.

Happy toggling!

How fancy are you gonna get with your custom toggling in Tableau? Tell us about it in the comments or send us a message to chat.

Ever wished you could facet, filter and do other magic on a dataset that also had aggregated data from a summary table in Tableau CRM?  

There is a way!

For example, you want to look at all the scores in the Pardot engagement history object, but also would like to use the same report to show summarized campaign information.

The dilemma?

When you bring in the summarized data and join it by Campaign, each Activity row will contain the data for the entire campaign. While it will make your campaign numbers look spectacular, it will also be spectacularly wrong!

What to do?

Use a flag to differentiate summarized data

Tableau CRM has an AMAZING feature that lets you create a row number that you can use as a flag to differentiate between summarized and detailed data.  

How? You can use the flag in your dashboard widgets to summarize or exclude data as needed.

Here’s how it works:

  1. Join your data as usual. Here we are joining on ActivityCampaignID in Pardot Engagement history to the ID in the Campaign table after we aggregate the metrics we want from Campaigns (leads, cost $ and opps $).
  2. Use a transform in your recipe to create the “flag” / unique identifier.
  •   Select Add transformation.
  •   Select Multiple row formula at the top.

The multiple row indicator allows Tableau CRM to “partition” the data so you can look at groups of data within the data and apply metrics to the specific group. 

In this instance, we are grouping by the CampaignID to assign a row number for each instance of the campaign (starting from 1).

  1. Select Row Number.
  2.  Select the field you wish to create row numbers from.
  3. Select numeric.
  4. Give it a name and save.
  5. Complete your recipe and run!

You now  have a “flag” that can be used in your recipe.  Each #1 in the row can be used to reflect the “unique” campaign aggregate.

The flag gives you access to accurate data

Now you can use this flag in metrics and KPI widgets where you want to see the campaign metrics. 

Example

By adding the flag we created to the filter for summary statistics around Campaigns, we are able to limit the  distinct Campaigns for our KPI/top level summary. But we are still able to see the row-level detail for non-aggregated data (like score).

Why is this great?  Now you can use the SAME filters, toggles and other interaction features to see detail AND the summary.

Using a single dataset, we can now view the Campaign stats (which we aggregated) and all the activity details our marketing teams crave!

Have a fun use case for this solution? Tell us about it in the comments.

Change your data columns to rows in Pardot B2B Marketing Analytics/Tableau CRM

Has this ever happened to you? You wish you could change your Pardot B2BMA data from columns to rows.

You have all the Pardot B2B Marketing Analytics data you want in a single column, but you need to create B2BMA reports that show the data as rows.

For Example:

Your data looks like this.

B2BMA Columns to Rows 1

But you want the data to look like this.

B2BMA Columns to Rows 2

So you can make visuals like this!

B2BMA Columns to Rows 2

And you want to do this without using a complicated query on the front end of your dashboard that could limit the ability to filter and sort the data…

There are many ways to accomplish this. But one of the simplest and most manageable methods is through a data recipe using the Append (UNION) and transform filters. This approach allows you to tweak your rules and data without code on the front end so you can keep your dashboard creation options flexible.

Changing Pardot B2BMA data columns to rows

Step 1: Figure out what fields and filters to add.

The first step is to identify the rules.

  • What determines each type?
  • Which fields are needed for the data visual?
  • What filters do you want to include?

In our example, we know the MQL (Marketing Qualified stage) has been reached if the “Date__Qualified” date is greater than 1971-01-01’. Each stage has its own rules.

To create our dataset, we need to determine what fields and filter to add:

  • MQL Status (rules fields) and MQL Date
  • SQL Status (rules fields) and SQL Date
  • SAL Status (rules fields) and SAL Date

Filters: Country, Account name

When creating your dataset, be sure to document what fields are needed. Keep the field list as small as possible (you can always add more fields later if needed). Less is more for performance and useability in this case.

Step 2: Choose the fields you need.

Open your data recipe and select the dataset. Choose only the fields you need. This will keep the dataset manageable. You should pick all the fields needed to create the rules and the fields you will use to filter. Document everything you select as you will be repeating this process for each row type.

LeadsCompleteSercante

Step 3: Attach a transform to the dataset.

In this next step, you’re going to attach a transform to the dataset. Select the ‘custom formula option.’

In our example, anywhere the qualified data is after ‘1971-01-01’ we flag the type as MQL, otherwise we leave it blank.

Attach a transform to the dataset

Step 4: Add your rule and create a new field.

Use the “CASE” function to add your rule and create a new field. This will create a new field (BusinessStage) that will indicate ‘MQL’ where the qualified data is valid. Set the field type as text and Make sure to rename the field

Code Sample:

case 
when Date_QualifiedMQL__c >’1971-01-01′
then ‘MQL’
else ‘’
end

Add your rule

Step 5: Attach another transform.

Attach another transform to populate the correct date using the custom formula. We are essentially creating a date field that will be the “main” date for our dataset and allow the aggregate on the dashboard.

Code Sample:

case
when Date_QualifiedMQL__c >’1971-01-01′
then Date_QualifiedMQL__c
else Date_QualifiedMQL__c
end

Attach another transform

Step 6: Add a filter.

Add a filter to whittle your dataset down to just the “MQL” data.

Filter
B2BMA Columns to Rows 2

Now your dataset looks like this with “SQL” as a FunnelStatus and the SQL Date as the FunnelDate. 

B2BMA Columns to Rows 2

Step 7: Repeat steps 1 through 6.

Repeat steps 1 through 6 to create the next row type. For each, make sure your CASE statement reflects your rules.

Repeat Steps

Step 8: Append the dataflows.

Append the two dataflows together with the Append connector. Each dataset must have identical rows to connect them as one (unioned) dataset.

Append the dataflows

Now your dataset looks like this. Your SALs and MQLs have gone from columns to rows!

B2BMA Columns to Rows 2

For each remaining variable, repeat steps 1-7 with correct transformation rules and add append to the dataset as you go.

B2BMA Columns to Rows 2

Step 9: Create an output object.

Once you have added all your types in filtered “sub” datasets, create an output object.

Once you run the data flow, you will be able to use the FunnelStage and FunnelDate to do summaries without complex code. If the rules change for creating the FunnelGroups, change the Transforms in the recipe or add new ones.

Now you can use your new dataset to create visuals by date and type or create a summary table. 

Further considerations for reformatting Pardot B2BMA data

Here are a few things to keep in mind as you’re getting started.

  • You can use joins to add other datasets to your recipe – note they have to exist for all “streams”
  • Verify all desired variables have been accounted for (in our example after you filter SQL, SAL and MQL are there rows that are not brought in that you might need in your analysis? )
  • You can bring in as many columns as you need for filtering. Since we are turning each “column’ into its own row, each new column can contain the same data it had before, making all filters in the original dataset available.
  • Make sure you do a reality check on the data including:
    • Expected row counts
    • Expected amount totals
    • Missing values
  • Note that when you create rows from columns, you need to decide if you want ALL data converted or just the data that meets the rules you set. If in doubt, create an additional data stream that filters out all records that don’t meet any of the criteria and make sure to review those. What’s not there might be important too!

Further reading:

The ability to designate Pardot Accounts as campaign members is finally here!   

Included in the Salesforce Spring ‘21 release is a beta feature that’s going to make many Pardot admins and users happy. 

Here is what you need to know so you can get started using the new Accounts as Campaign Members feature in Pardot.

One action to reach all contacts within a Pardot account

Why does this new feature matter?  

There are many times when the communication you send to your customers may relate to the full account versus just a single contact.  Adding the account also mitigates potentially missing opportunities.  For example, this would be helpful for when the key contact for the account leaves. Other account contacts would still be able to receive the communication even if the contact is no longer active.

How do I set this up?  

Setup is easy!  Open Salesforce settings and search for “Accounts as Campaign member” then click enable.  That’s it! Well Almost…

Likely you will want to have the ability to add the account to a campaign from the account page.  To accomplish this, add the Campaign History Related to list to the Account Page layout.

  • Go to Salesforce setup > select objects > open the Account object then open page layouts. Add the related list and save.
Accounts as Campaign Members 2

You will also want to make sure you take full advantage of the reporting by adding a new custom report type so you can create reports that show engagement by Account!

Open Salesforce Setup > search for Report Types

  • Select “New Custom Report Type”
  • Select Campaign as the Primary object and the accounts object as secondary as shown below
  • Save 
Accounts as Campaign Members 3

Reporting considerations

What options are available to report on Accounts added to Campaigns?

  • The standard campaign with campaign members gets a new member type = Account.
Accounts as Campaign Members 4
  • The Standard report campaigns with accounts gets the account information added.
Accounts as Campaign Members 5
  • Reports created based on your new custom type allow you to review campaign activity by account.
Accounts as Campaign Members 6

Important things to know

Here are a few other considerations you should keep in mind when you enable the Accounts as Campaign members feature in Pardot.

  • If you add an Account to a campaign and that account has Opportunities but these opportunities are not added to any campaign, you cannot see those opportunities in the campaigns with Opportunity reports.
  • Opportunities created through the campaign will be associated with the account but separate from the campaign.
  • If Opportunities from the campaign are added manually to the campaign, then it will show in the pipeline and won Opportunities reports.
  • Adding accounts to the campaign will not change or affect contact roles for the account members added.
  • Records and activities created on Accounts before or after adding the account to the campaign will not impact the campaign Dashboard or campaign influence
  • Leads associated with accounts (like those through Lean Data or other tools) are not automatically added to the campaign.  These need to be added manually.

How do accounts added to a campaign appear in a Dynamic Pardot List?

Objects that are created around the Account as Campaign members exist in Salesforce to link Account and Campaigns together on the Salesforce side.

Account contacts added to the campaign will NOT show up on Pardot Dynamics lists as a prospect.

Learn more about Accounts as Campaign Members in Pardot

Want to know more?  Check out these helpful links! 

Remember to reach out if you want to know more about setting up these features in your Pardot org. Or comment below to let us know your thoughts.

No more posts to show