
Components are a hidden gem in the CRM Analytics (formerly Tableau) toolbox. You can re-use them in any dashboard and then centrally make changes that affect any dashboard where the Component is placed. But before the Salesforce Summer ‘23 release, they had to be identical on every dashboard!
If you wanted revenue by State on one dashboard and revenue by Country on another Dashboard, you needed two different components.
Not anymore! Here we provide a step-by-step guide (with pictures) to get you feeling confident and excited about using (and re-using) these amazing widgets. Thanks to the Salesforce Summer ‘23 release, you can now use parameters to make component widgets dynamic.
How to Make Component Widgets Dynamic in CRM Analytics
Ready to get started? Here are the steps to making your CRM Analytics component widgets display dynamically using parameters.
Step 1: Create a Component
There are a few ways to do this. I’ll outline the method that flows best with dashboard creation. But like many Salesforce tasks, there is more than one way.
- From a dashboard, drag the component widget to your dashboard.
- From the dialog box, select Create New Component.

- Add a widget to your new component.
- In our example, we are using the Account Engagement (Pardot) Prospects and grouping by country.

- Save your component
2. Add a Parameter to your component
- Click on the Component Widget and choose the advanced editor from the widget menu.
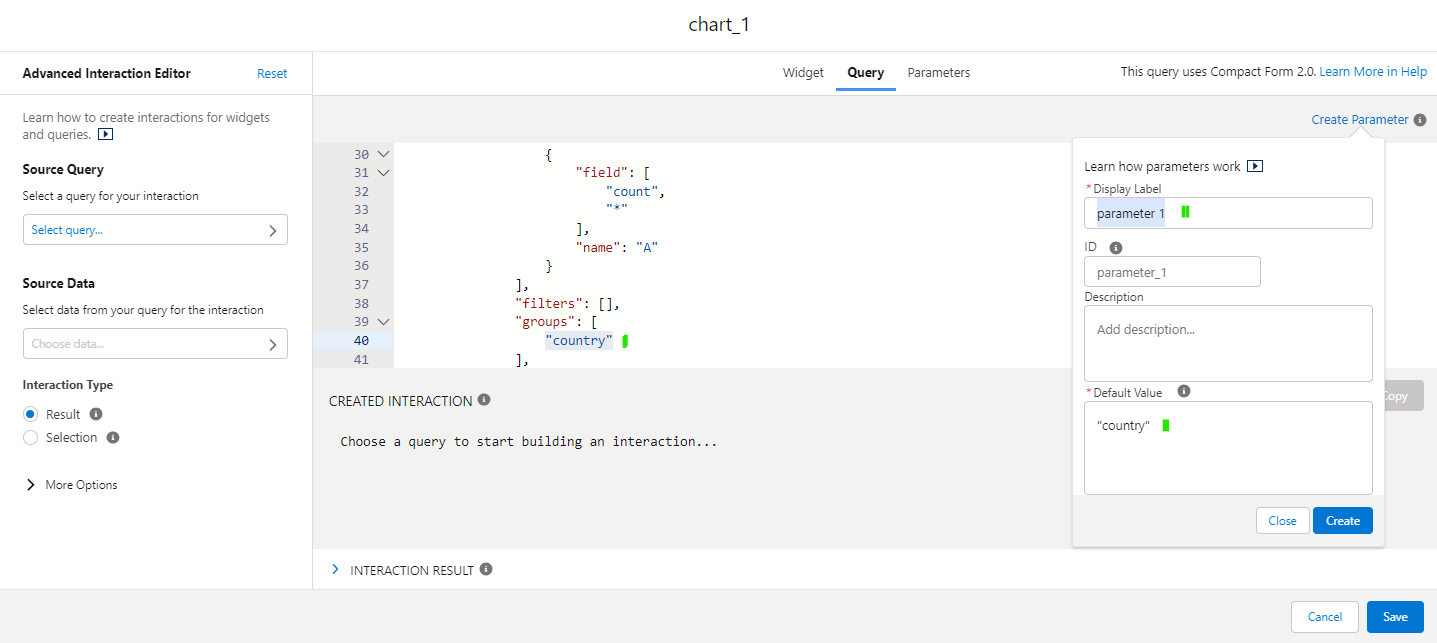
2. On the Query Tab, find the value you want to parameterize. In our case it’s “Country.”

- Click on the pages icon (next to ID to copy the parameter to your clipboard)
- Click Create (or update if altering an existing parameter). Note: The value MUST be in the correct case (NOT Country)
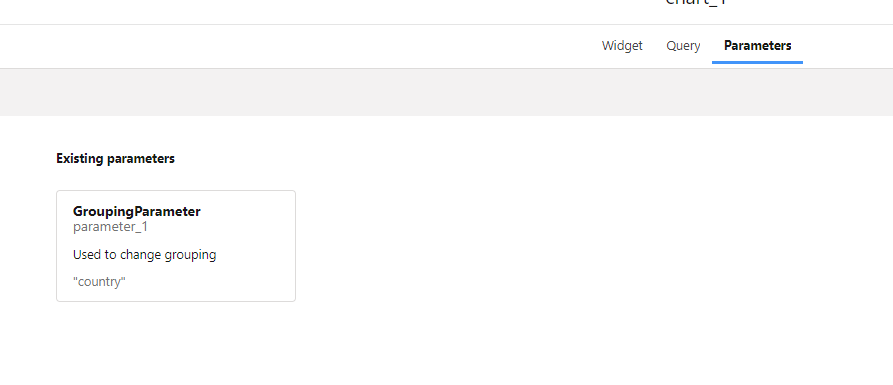
- Click on the Parameters tab to see what you just created.
- Next, change the query to use the parameter. Go to the query tab and replace the group and name with your new filter. Where you see city, replace as shown below for the group and name
Group:
      "groups": [
          "[[parameter_1]]"
        ],
        "filters": [],
        "joins": [],
        "name": "pdProspect1"
      }
    ],
Name:
  {
        "name": "[[parameter_1]]",
        "ascending": true,
        "filters": []
      }
- Save your query.
- Save your component.
3. Using the Component on Your Dashboard with the Parameter
Now that you have your component with a parameter created, let’s add it to a dashboard and change the parameter. This is the fun part!
Return to the dashboard tab (should be an open tab in your browser), and click on the component widget to select the new component we just created.
Pro tip: To refresh component content or edit, look for the actions in the right side toolbox when the component is selected.
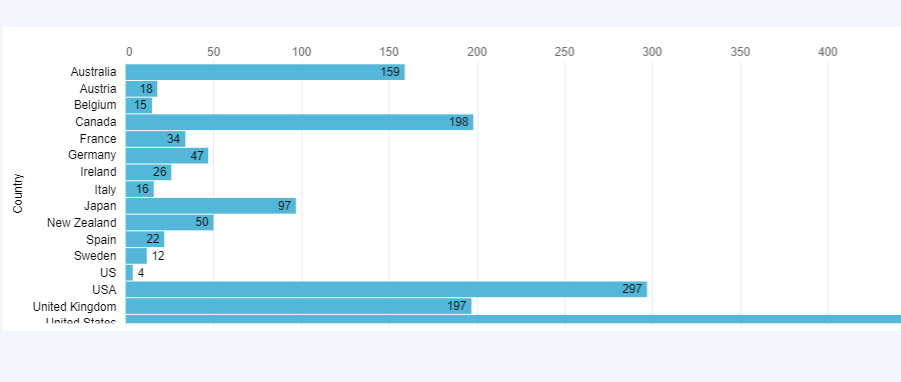
Preview the Dashboard
It looks like this: It’s displaying by Country
Change parameter
Now let’s change the parameter.
- Edit the dashboard.
- Click on the component, and click on Parameters (right hand side).
- Click on the parameter you created.
- Select Static for Value Type.

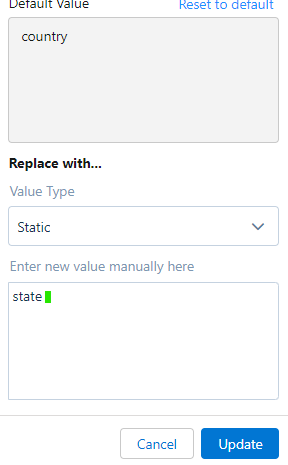
- Replace country with state. Click update.

The component now displays State.
You can parameterize other aspects of the component (filters, etc.), so there are lots of possibilities here.
What else can I do when I make component widgets dynamic?
The example in this blog is quite simple. However, it gives you the elements to be successful in creating and using CRM Analytics components.
These CRM Analytics enhancements give us opportunities to make dashboards more useful and allow us to finally re-use components effectively.
Some great use cases:
- Sales by Group or District
- Product type filtering (for different dashboard)
- Scenarios where you have different revenue fields (USD or CAD for example or expected vs actual)
The Salesforce Summer ‘23 release has given us so many gems. This CRM Analytics update is a big one along with the ones we’re seeing with Account Engagement including the ability to copy marketing assets between business units, and this update to Salesforce user access management.
Need help digging into this super helpful feature? Or wondering how this can fit into your overall marketing reporting strategy? Reach out to the team at Sercante to start a conversation.