
You have your lead lifecycle set up, your scoring set up, and the marketing qualified leads (MQLs) are flowing in. Now it’s time to pull reports in Salesforce to see how you are doing against your targets. Maybe you don’t know where to start, what reports to pull or what extra data points you need. In this post, I’ll share some example MQL reports and some tips and tricks for creating reports in Salesforce.
Getting your MQL data ready
To pull the reports outlined in this post, you will need to ensure you are collecting appropriate data points. Here are some data points that are used to create the MQL reports.
- MQL Date: The date the lead became an MQL.
- Recycle/Nurture Date: The date the lead went from MQL to recycle/nurture or whatever the equivalent status you have set up.
- Rejected Date: The date the lead was rejected because it’s not the right fit.
- Age New Lead > MQL: The number of days between when the lead was created and when the lead became an MQL.
- Age MQL > Recycle/Nurture: The number of days the lead was an MQL before moving to the next stage.
- Recycle/Nurture Reason: The reason the lead was marked as recycle/nurture.
- Rejected Reason: The reason the lead was marked as rejected.
Need help setting up these fields? Check out this post to learn how to date stamp field changes in Salesforce.
The Basics
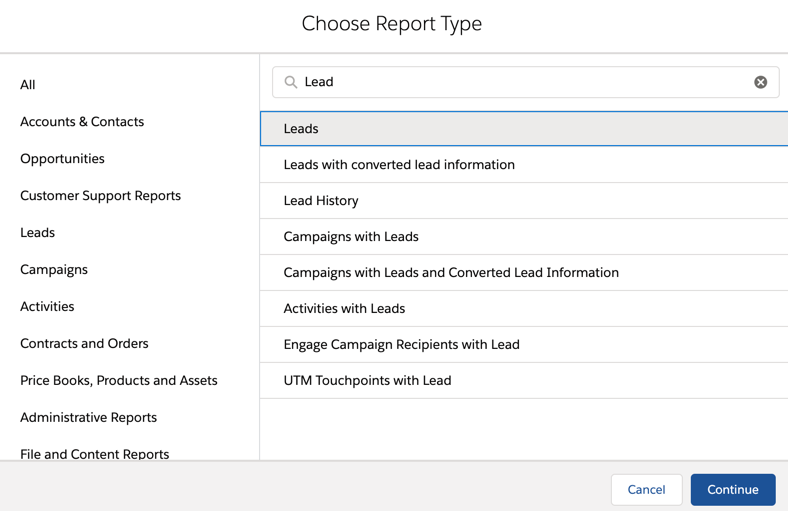
Most MQL reports will use the default “Leads” report type.
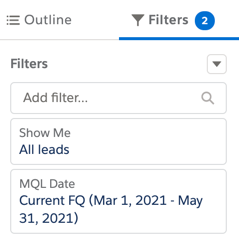
For the report filters, you almost always want to use the show me all leads option. You also can update the date filter from created date to MQL date.
Group rows by searching for the field name in the group rows section. When grouping by a date range, click on the arrow next to the field to group the date by day, week, month, etc.
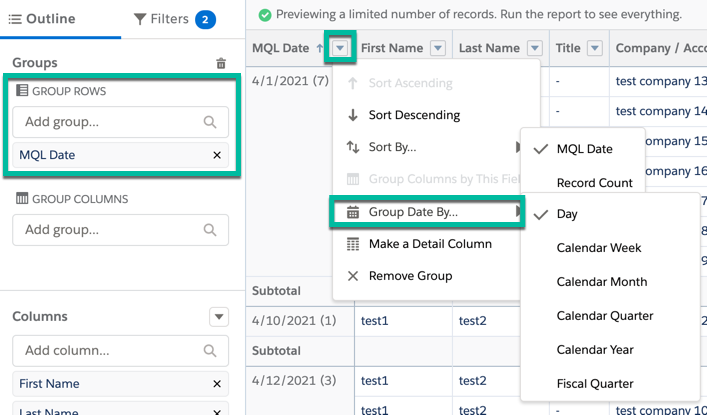
Tip: Don’t forget you can group by more than one row!
You can also group columns by searching for the field name in the group columns section.
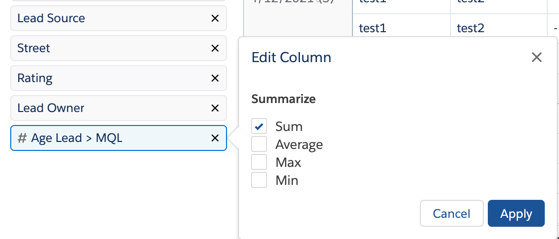
When adding a number field to your report, you have the option to summarize the field using sum, average, max and min. To change the summary option, click on the field name to bring up the edit column options.
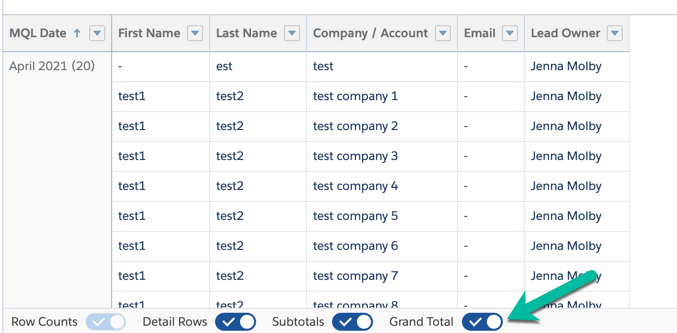
Use the toggles along the bottom of the report to show/hide information for your report. For most reports, you will probably want to hide the detail rows.
Example Reports
Here are some example reports and what filters to use to create them.
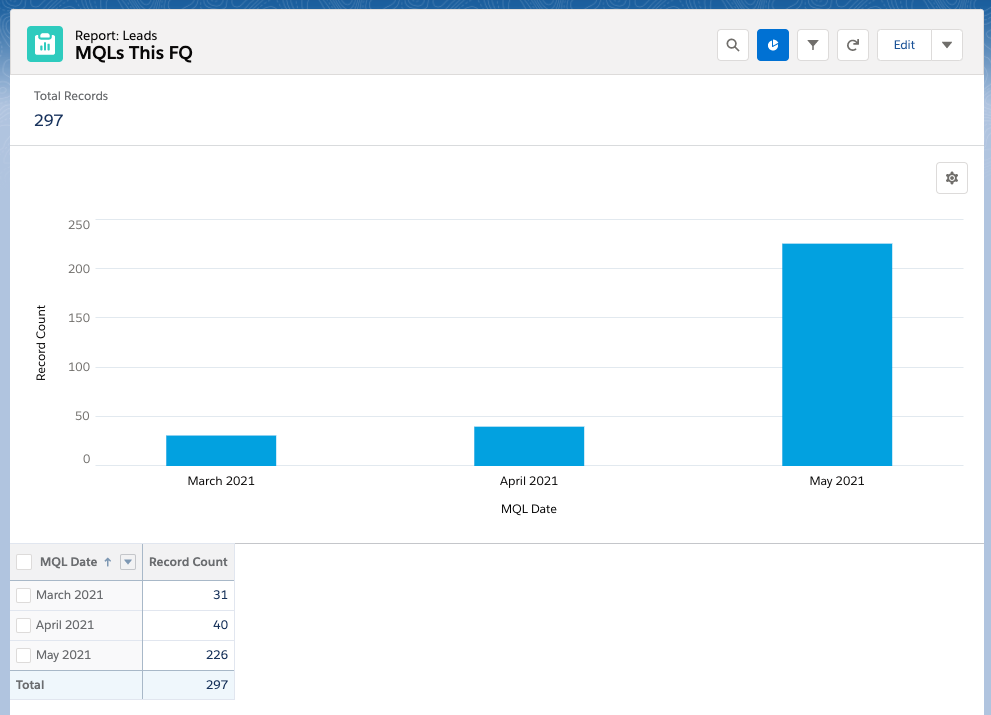
MQLs this quarter
How many MQLs did we have this quarter?
Filters: All leads, MQL Date is current FQ. Grouped by MQL date (by month).
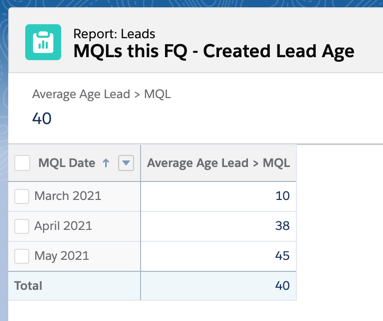
Average number of days between lead created date and MQL date
How long does it take for a new lead to become an MQL?
Filters: All leads, MQL date is current FQ. Grouped by MQL date and with the average filter turned on for the field “Age New Lead > MQL.
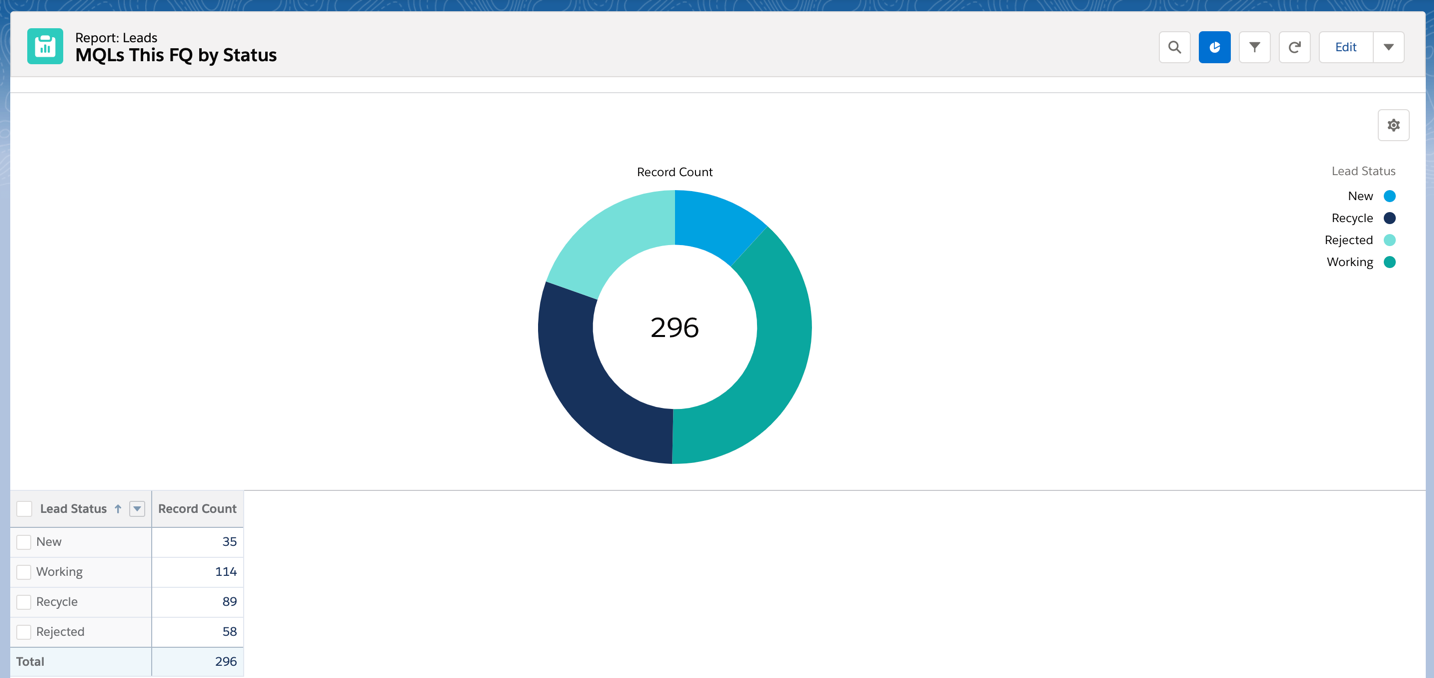
MQLs by Status
What status are the MQLs in?
Filters: All leads, MQL date is current FQ. Grouped by Lead Status.
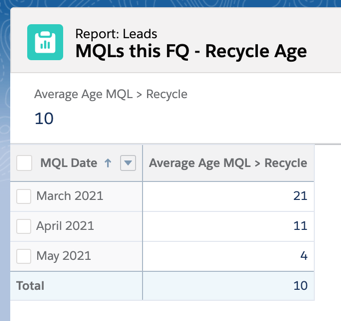
Aveage number of days between when an MQL is created and when the status is changed to recycle
How long is a lead in the MQL stage before being recycled?
Filters: All leads, MQL date is current FQ, recycle date is equal to “”. Grouped by MQL date with the average filter turned on for the field “Age MQL > Recycle”.
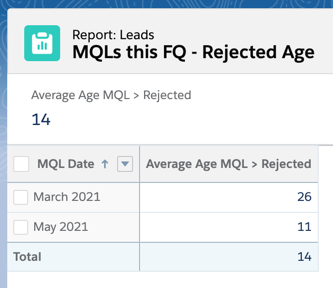
Aveage number of days between when an MQL is created and when the status is changed to rejected
How long is a lead in the MQL stage before being rejected?
Filters: All leads, MQL date is current FQ, rejected date is equal to “”. Grouped by MQL date with the average filter turned on for the field “Age MQL > Rejected”.
Leads by recycle reason
What are the main reasons for an MQL being recycled?
Filters: All leads, MQL date is current FQ, recycle date is equal to “”. Grouped by recycle reason and MQL date.
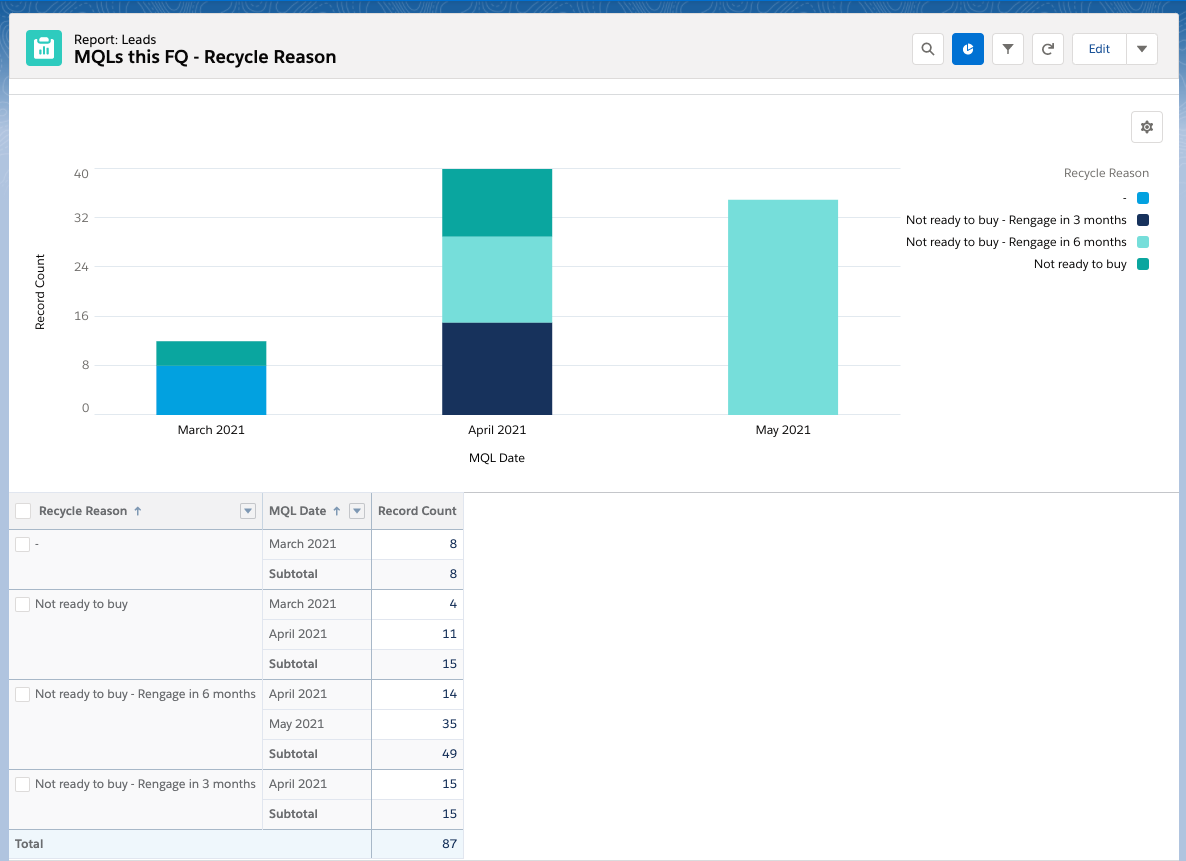
Same report can be pulled for rejected reason or any other related field.
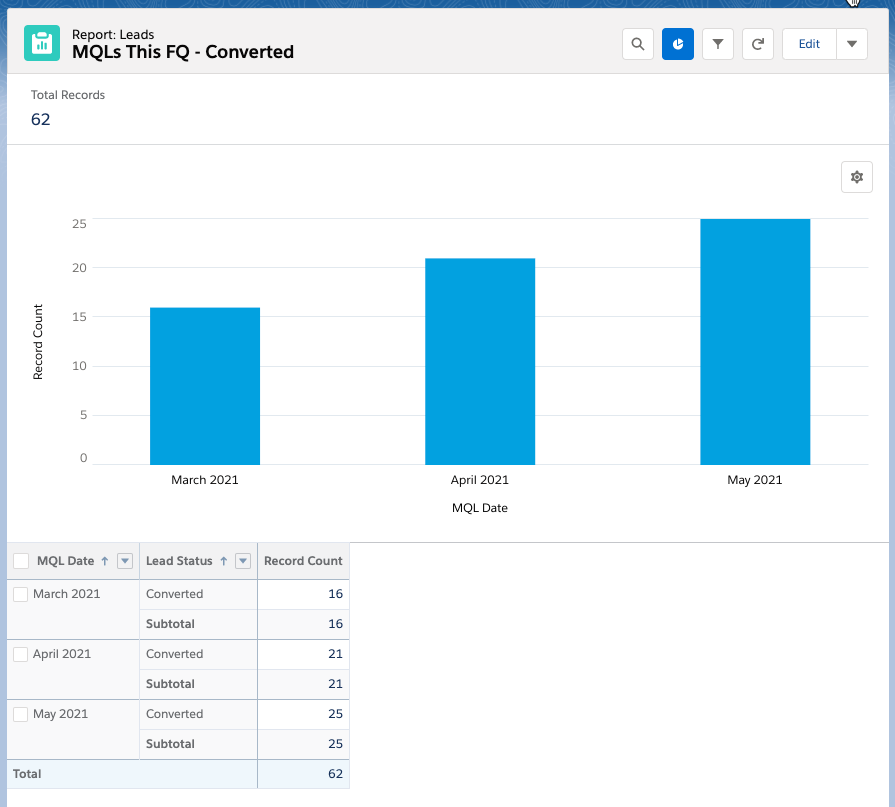
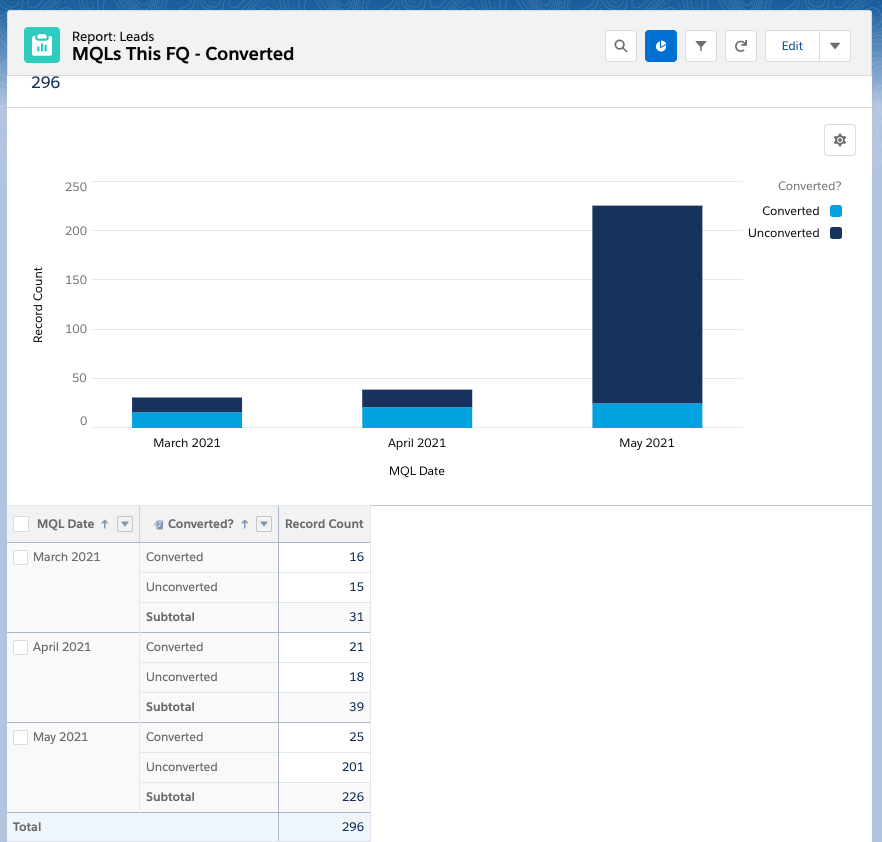
MQLs that have been converted
How many MQL leads have been converted this quarter?
Filters: All leads, MQL date is current FQ and lead status equals converted. Grouped by MQL date and Lead Status.
Tips & tricks
Add targets to your reports
How far away are you from your MQL target? You can add a formula field to your report to calculate the percentage of how close you are to any number. To do this, click on the arrow next to the columns section and click on add summary formula.
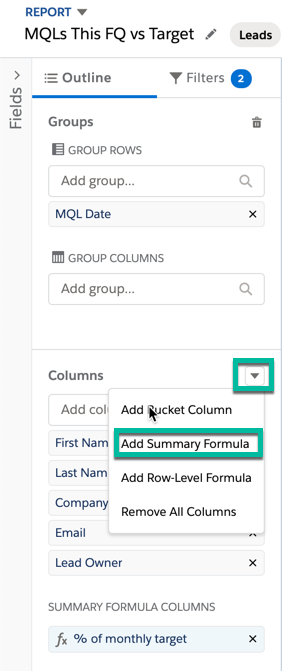
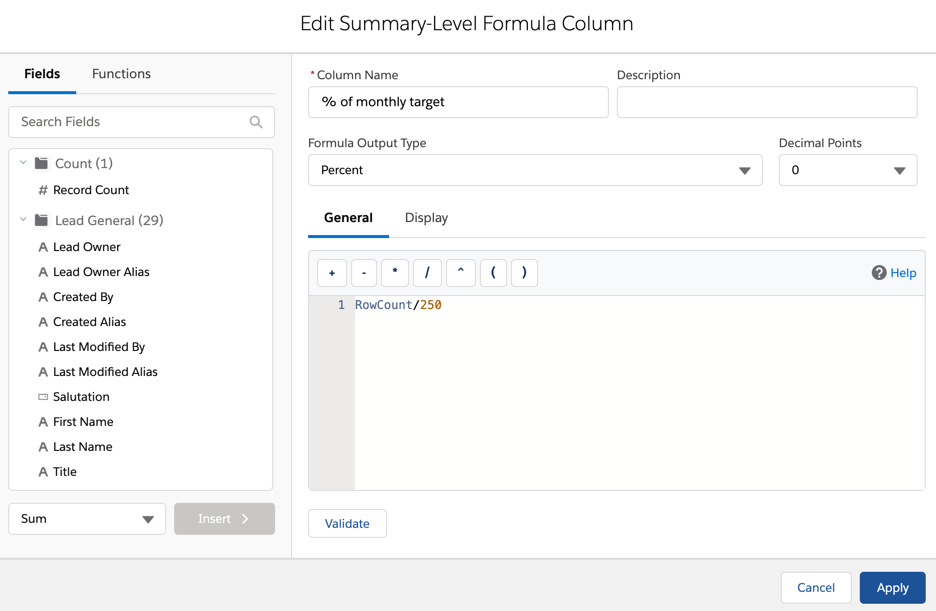
Give your column a name, select percent as the formula output type and use this formula RowCount/250. Replace 250 with whatever your target MQL number is.
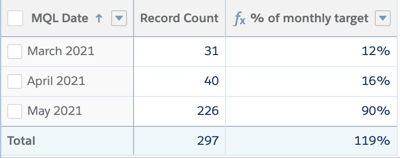
Run your report to see the calculation in action!
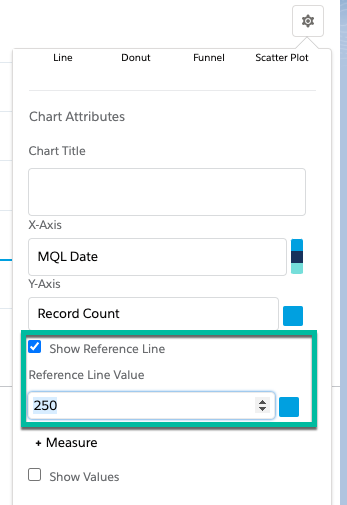
You can also add a target to your chart by going to chart settings. Check the box for show reference line and enter your MQL target in the text box.
Add bucket fields
Bucket fields are a great way to clean up your report by grouping field values. One way I like to use them is to show converted vs unconverted leads. In this example, lead status is updated to “converted” when a lead is converted, so I can use that field to bucket my fields to determine converted vs unconverted.
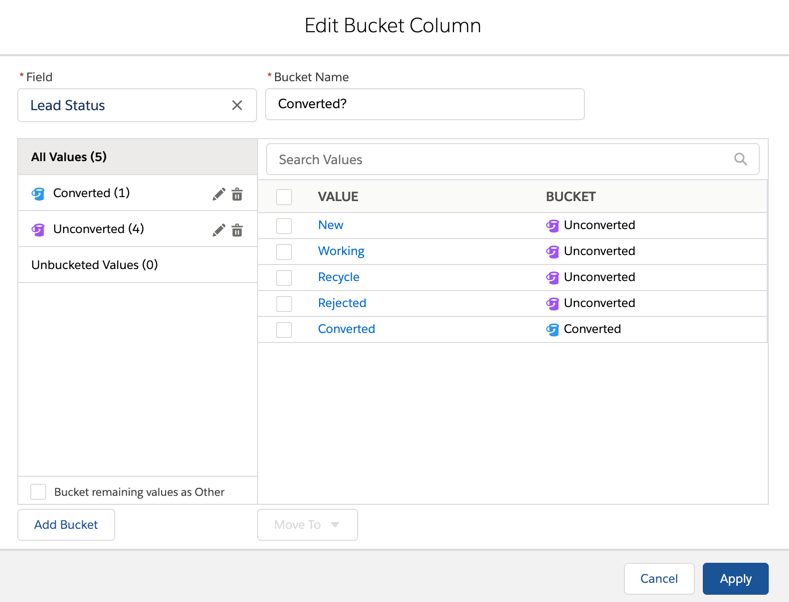
Note: There is also a field called “converted” on the lead which is a checkbox. You can also use this in your reports, but I it will only be a “true” or “empty” which can be confusing.
Don’t start from scratch every time
As long as you are using the same report type for your reports, there is no need to create a new report every time. Use one report and build off of it. Adding different filters and columns. Just make sure you use the save as button!
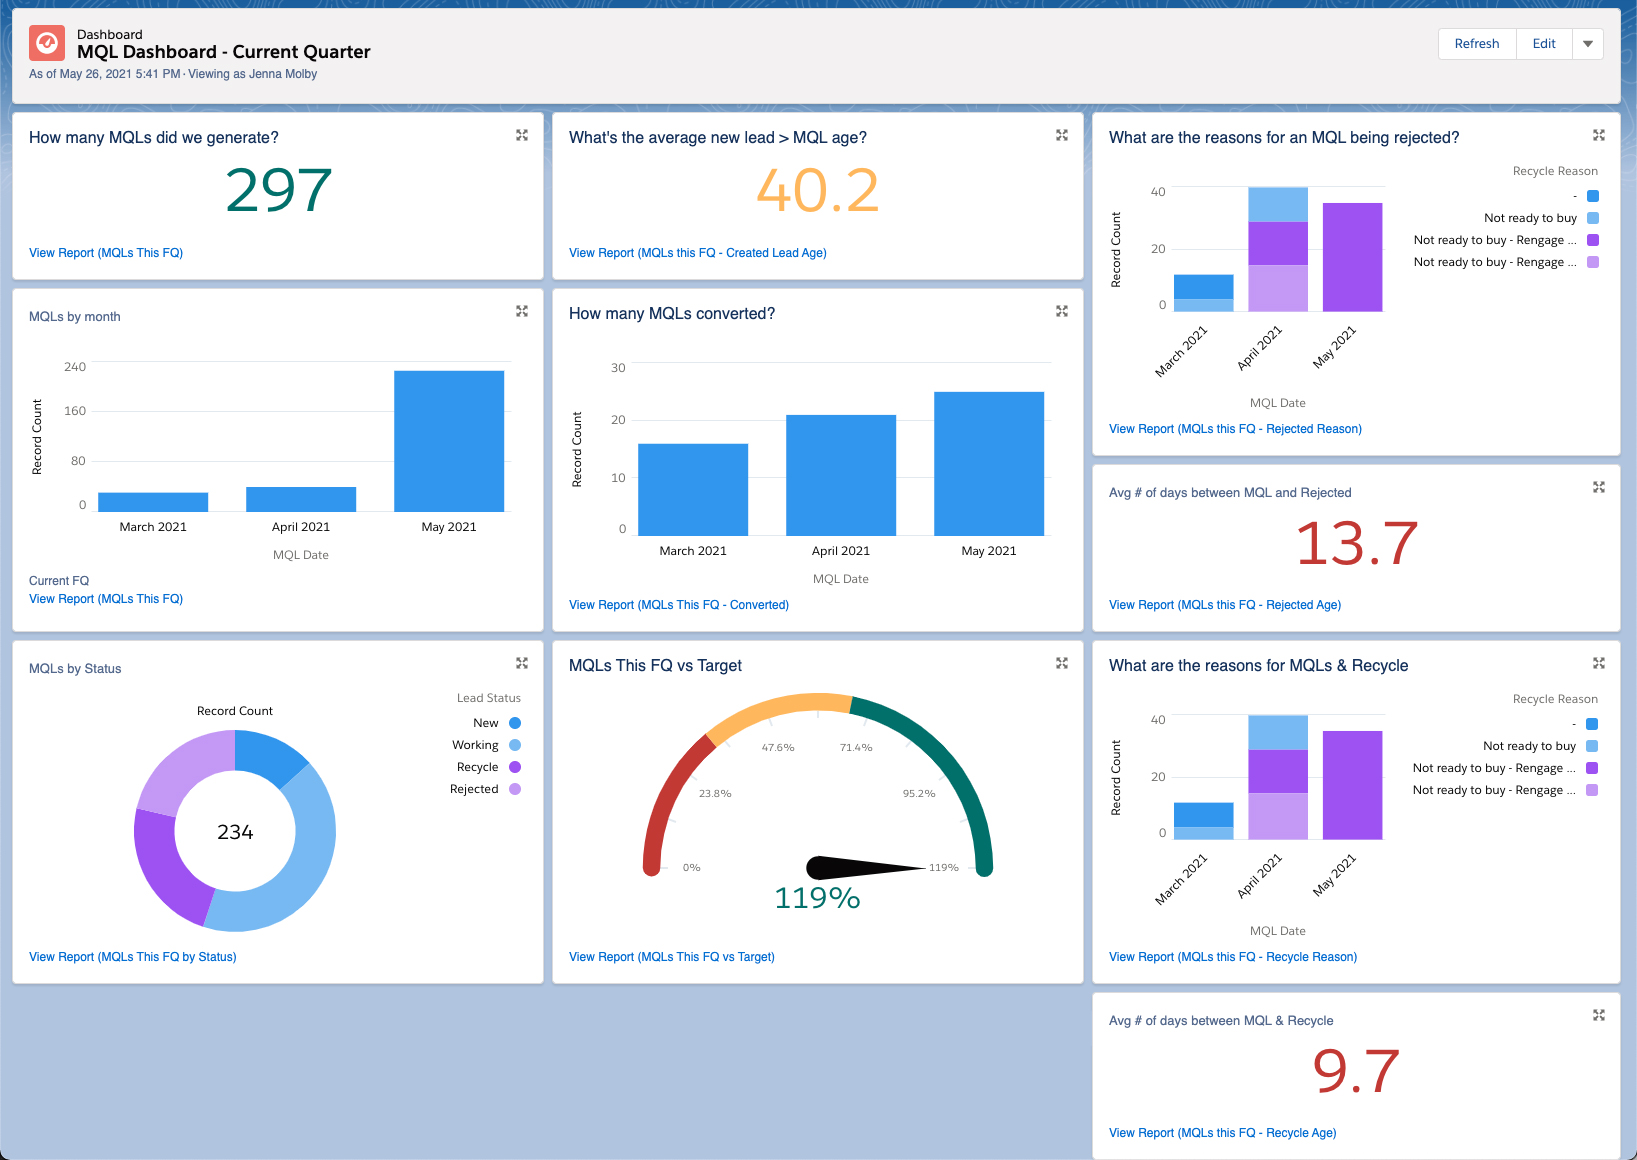
Dashboards
Once all your MQL reports are created, the reports can be used in dashboards like this MQL dashboard.
Send me a tweet @jennamolby, or contact the Sercante team for help.

