
Looking for a way to view your Marketing Cloud Account Engagement (Pardot) data within Salesforce? Not fully satisfied with data you’re able to view in the Account Engagement Reports? Well, you’re not alone. This is a comprehensive guide to B2B Marketing Analytics — what it is, what you’ll get out-of-the-box, and how you use the B2BMA dashboards.
What is B2B Marketing Analytics?
B2B Marketing Analytics (B2BMA) is a CRM Analytics App designed specially for B2B Marketers. It uses your Salesforce-Account Engagement connector to package up and display your Account Engagement data and enables several datasets to help you assess your sales and marketing performance. B2BMA comes out-of-the-box with default dashboards intended for various stakeholders on your team.
If you’re trying to view Account Engagement data within Salesforce, B2BMA should be your primary tool. It offers a wide range of data that can significantly improve your visibility into the ROI of your marketing campaigns, combining both marketing and sales pipeline data.

Key terminology within B2BMA
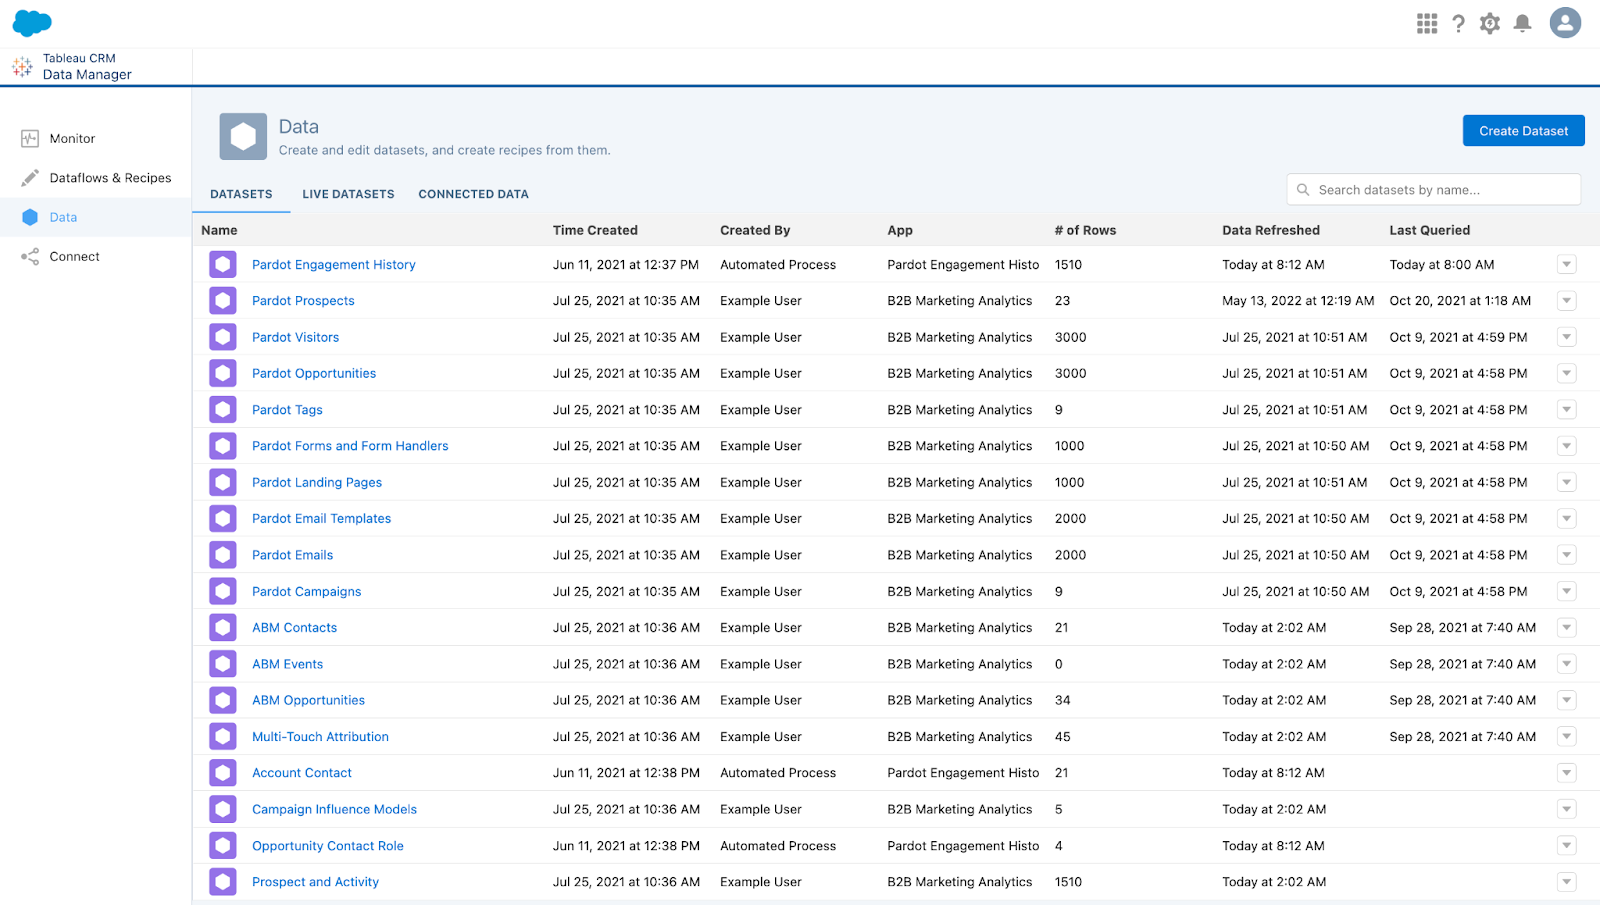
Dataset
Datasets are simply sets of source data (like an Excel table). These datasets are formatted and optimized for interactive exploration.
Note: With B2BMA Plus (a feature available with an upgrade) you can actually control how frequently the data syncs between Account Engagement and Salesforce.
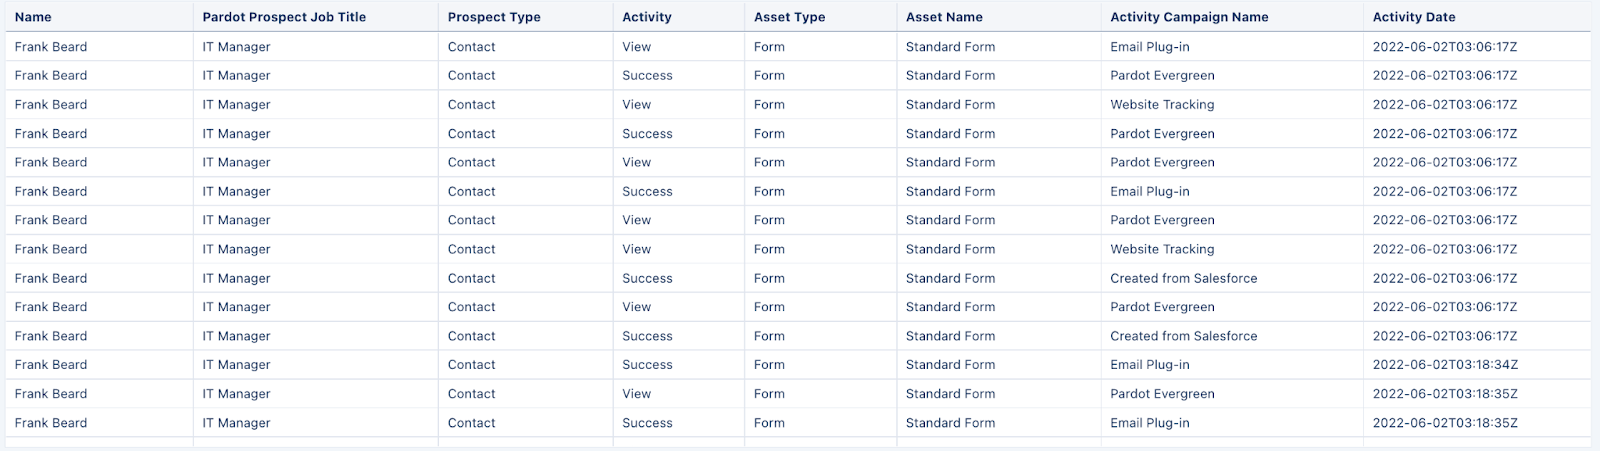
One example of a dataset may be your Account Engagement Prospects (see screenshot below).
Lens
A particular view into a dataset’s data (like a query). Use a lens to visualize your data and perform exploratory analysis.
You’ll get these four lenses out-of-the-box:
- Pipeline Deals
- Campaigns (Pardot Campaigns)
- Lead Sources
- Lifecycle Snapshot
Navigation: CRM Analytics App > All Items > Lenses
Example: Revenue by Campaign Type (see screenshot below)
Filter
Filters are used to narrow down results. Standard filters vary by dashboard. Keep in mind, you can add filters to a dashboard, but they may not filter all lenses within the dashboard. Some filters may also require customization.
Example: See all email engagement in a fiscal year
Dashboard
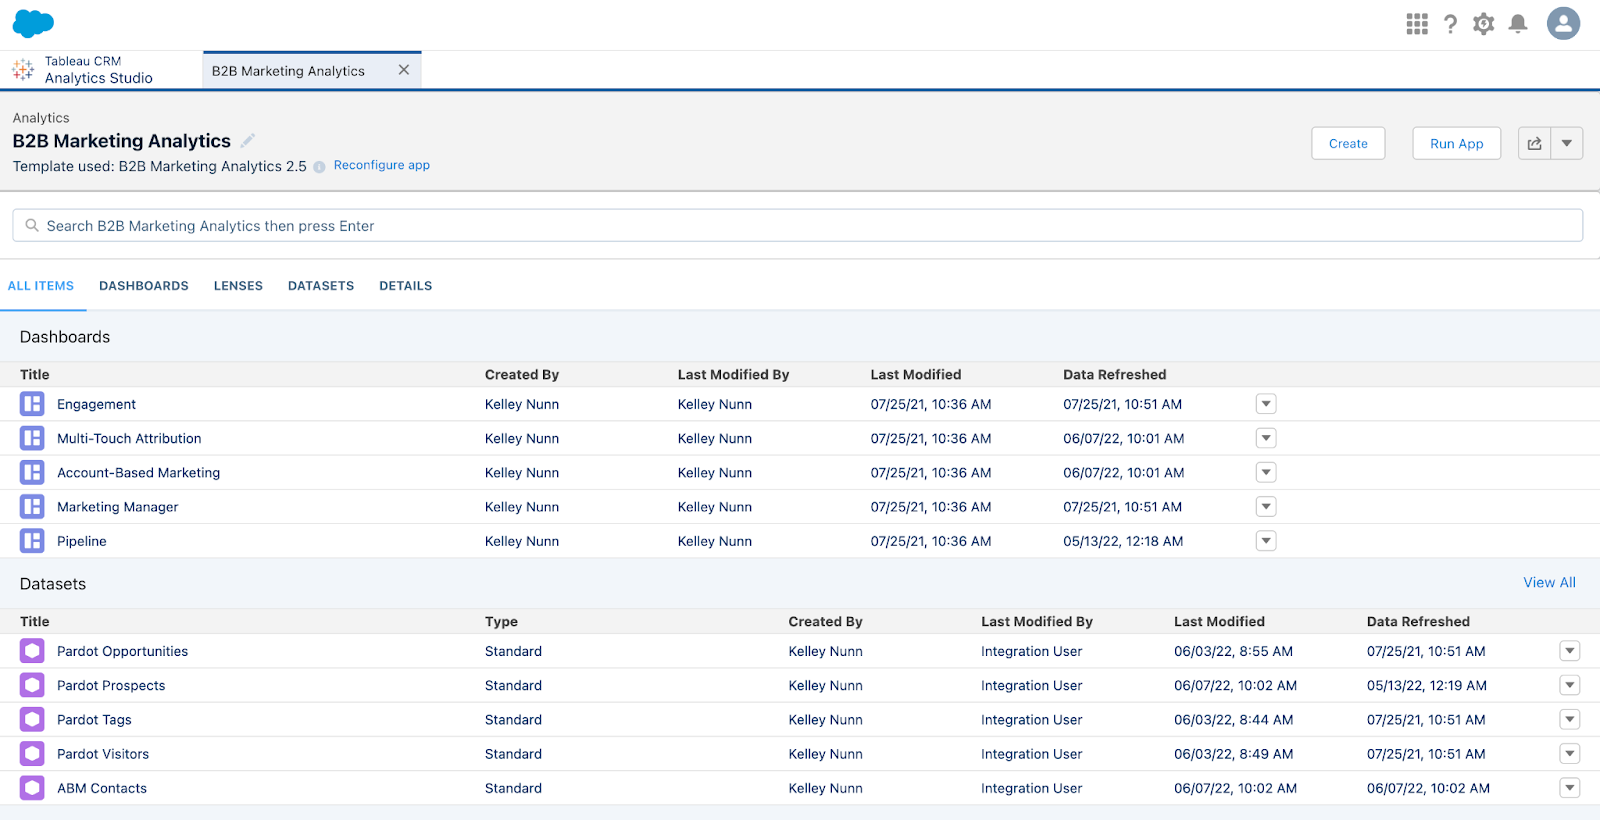
A Dashboard in B2BMA is a curated set of charts, metrics, and tables based on the filtered data from one or more lenses. These are typically designed to be used by a specific audience (e.g. Marketing & Sales Leadership). You’ll get these five dashboards out-of-the-box:
Navigation: CRM Analytics App > All Items > Dashboards
Pipeline Dashboard
Offers you a view of your sales funnel from Visitor to Prospect to Opportunity (Won/Lost). You’ll see the following metrics:
- Visitors
- Prospects
- Marketing Qualified Leads (MQLs)
- Opportunities (Open and Closed)
- Velocity metrics
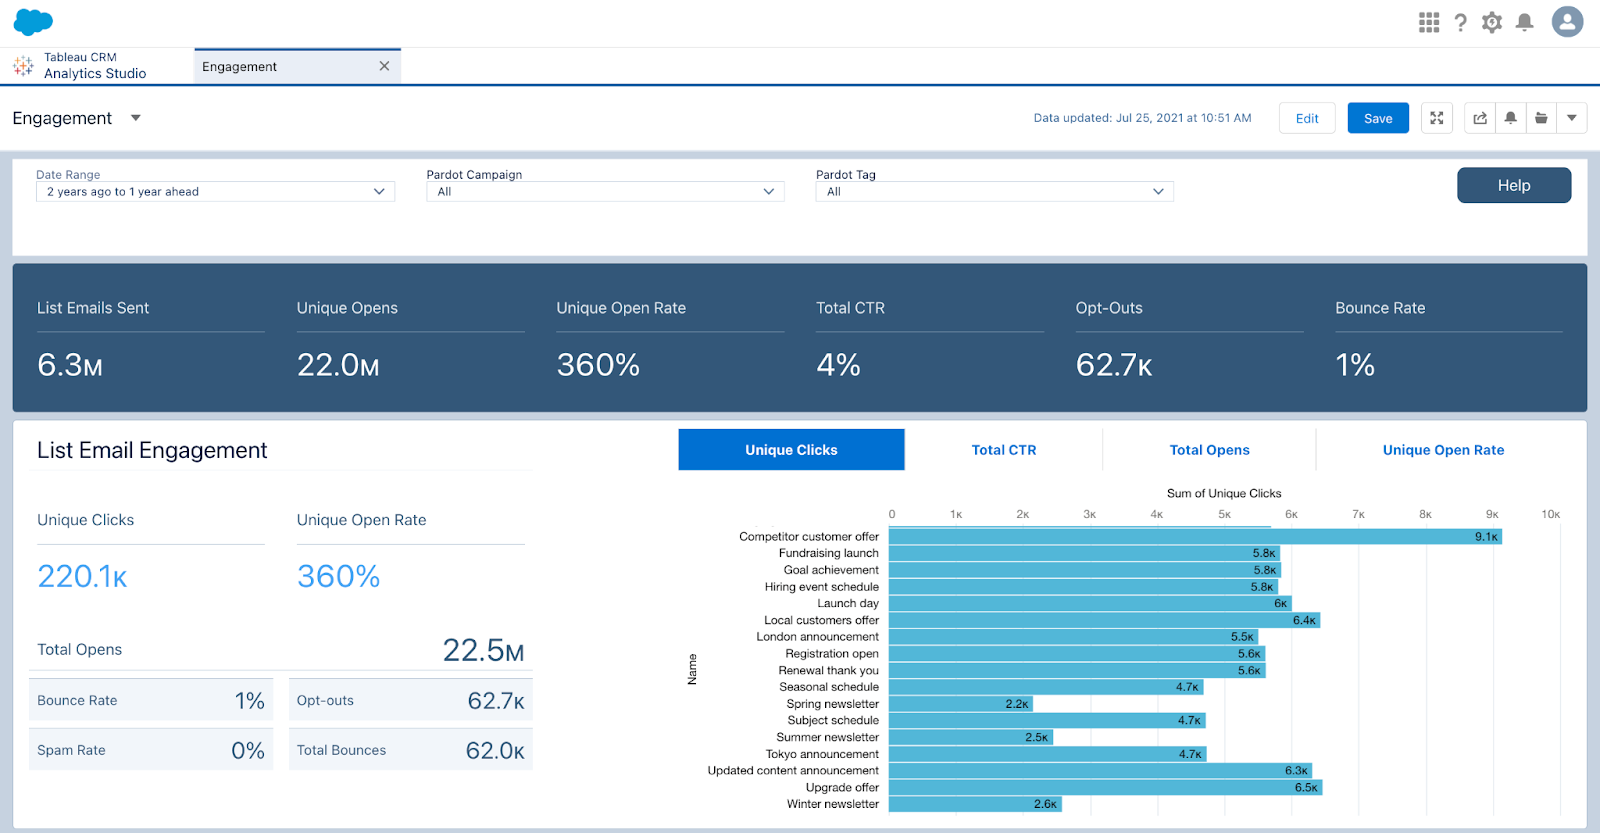
Engagement Dashboard
Offers a comprehensive view of your Account Engagement assets (think: forms, landing pages, emails, etc.) and how they’re performing and influencing your pipeline. You’ll see engagement metrics (opens, clicks, CTR, submissions, submission rate, etc.)
Marketing Manager
This is a combination of the previous two dashboards (Pipeline + Engagement) allowing you to see the overall performance and influence of your campaigns. You’ll see the following metrics:
- Marketing Asset Engagement
- Pipeline Deals
- Revenue per Campaign
Account-Based Marketing
You’ve likely heard of ABM before — but did you know there was a B2BMA dashboard built specifically for that purpose?
This dashboard monitors your ABM campaign performance and helps you take a deeper look at how Contacts and Opportunities from a specific Account are engaging with your marketing assets. You’ll see the following metrics:
- Account details
- Pipeline by Account
- Revenue win percentage
- Stage value by Account
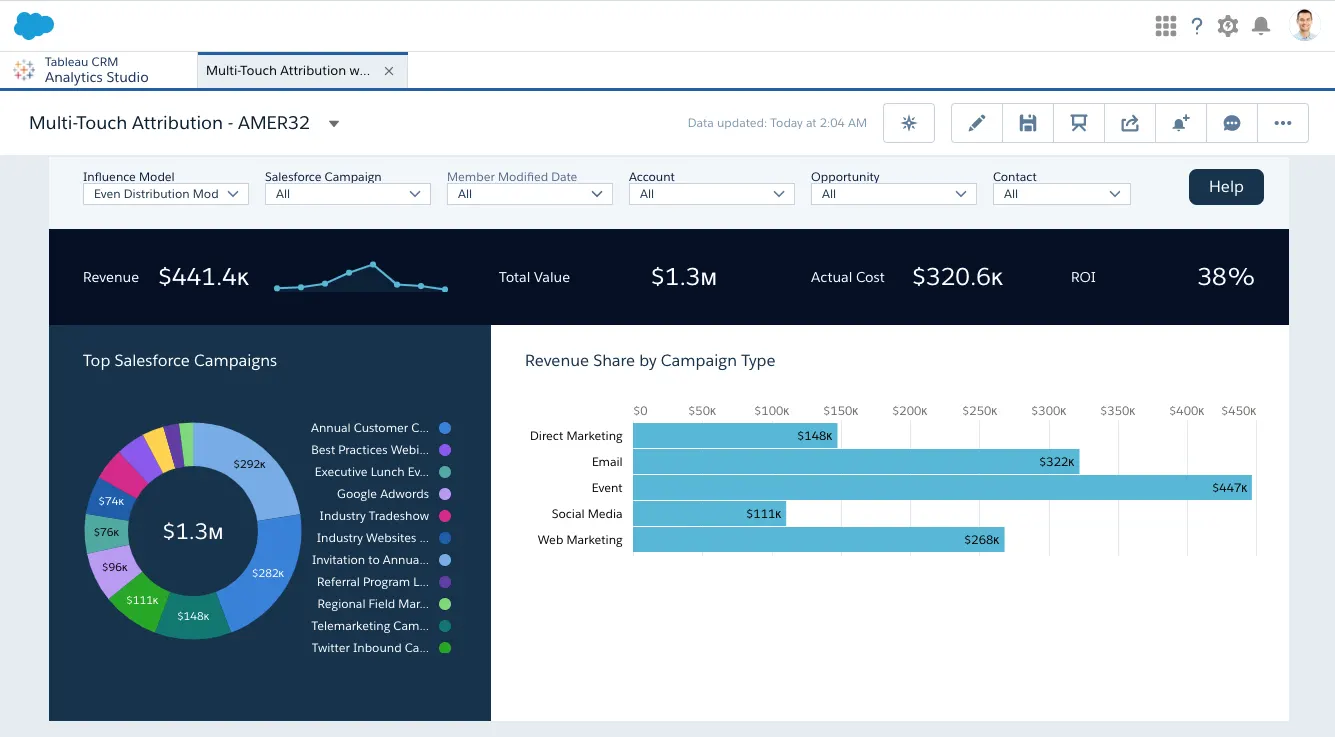
Multi-Touch Attribution Dashboard
This dashboard shows you how influential each of your marketing campaigns are during each stage of the sales lifecycle. It offers you three different attribution models to choose from: First Touch, Last Touch, and Even Distribution.
Within this dashboard, you’ll see these metrics:
- Revenue
- Total Value
- Cost
- ROI
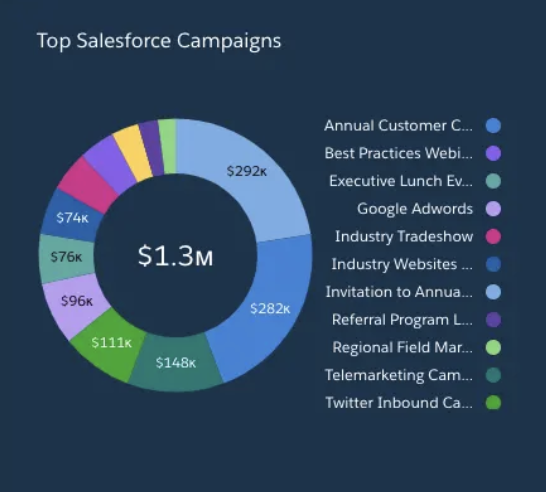
- Top Campaigns
- Revenue by Channel
Example: Multi-Touch Attribution Dashboard with Even Distribution (see screenshot below)
App
A CRM Analytics (B2BMA) App contains dashboards, lenses, and datasets in any combination that makes sense for sharing your data analysis with colleagues. Apps are like folders — they let you organize your data projects and control sharing across your team.
The included apps depend on your specific licenses.
Navigation: CRM Analytics App > All Items > Apps

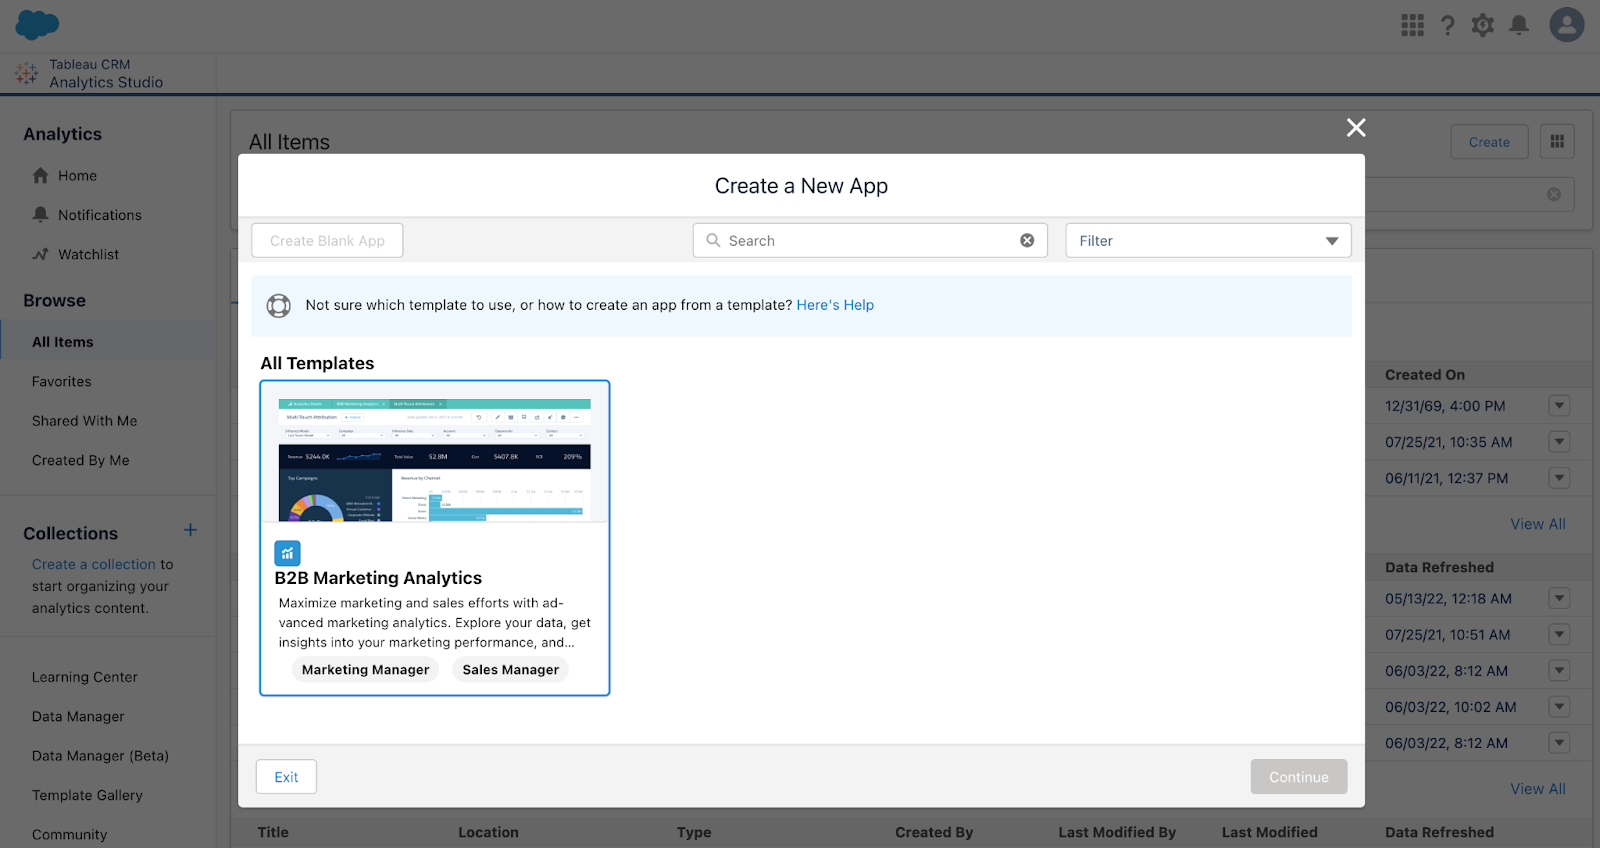
Template
A Template is a framework for analytics apps that comes preset with KPIs and data visualizations.
Navigation: CRM Analytics > “Create” > “App”
Functional terminology
Faceting
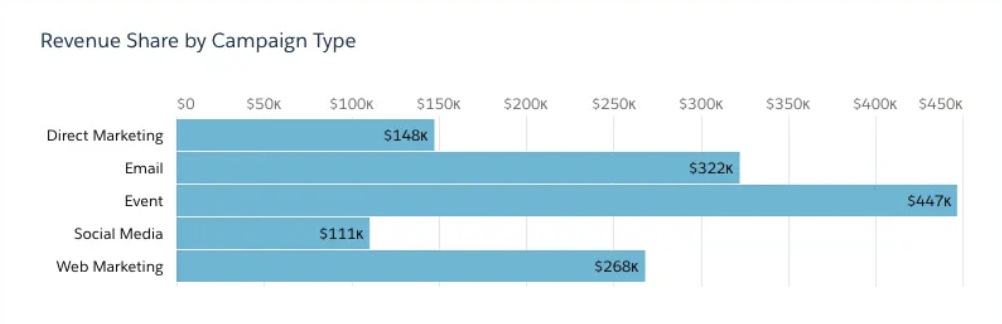
When Faceting within a dashboard, you can select part of a graphic, and the rest of the metrics on the dashboard filter by that selection.
Example: In “Revenue Share by Campaign Type”, click on “Web Marketing”
The dashboard will update to show to “Web Marketing” Salesforce Campaigns
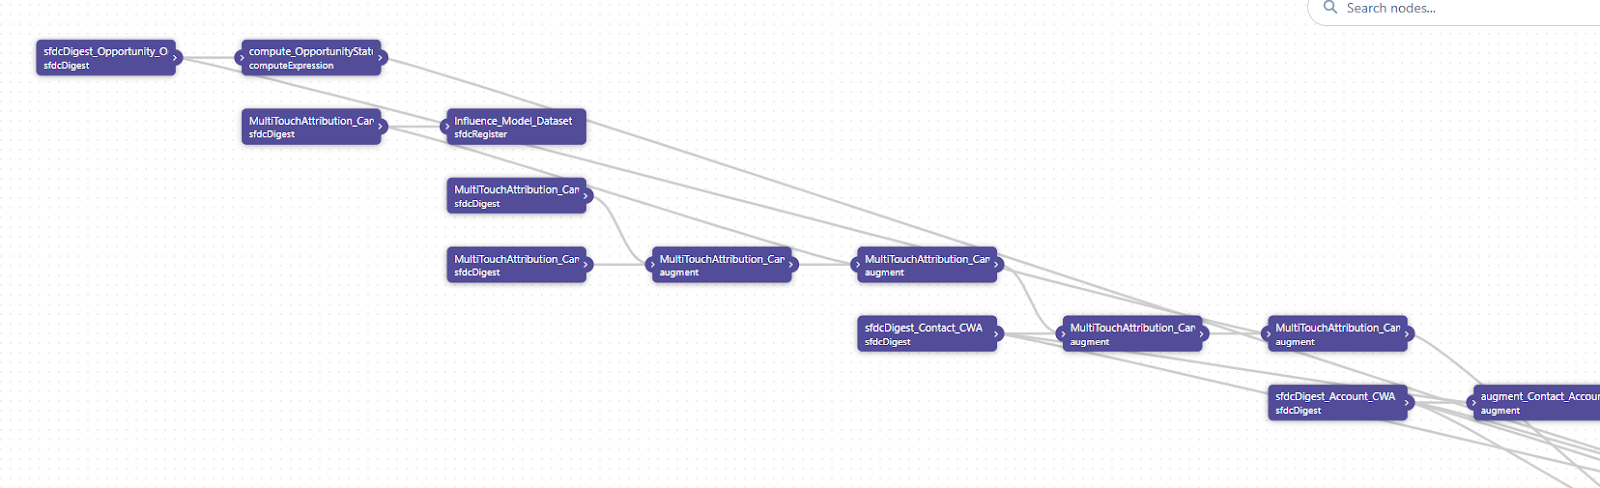
Data Flow
A Data Flow is a process that combines and summarizes several objects into datasets.
Examples:
- Connecting your Opportunities to your Accounts
- Modifying or creating datasets requires customization
Navigation: CRM Analytics > Data Manager > Data Flows & Recipes > Data Flows
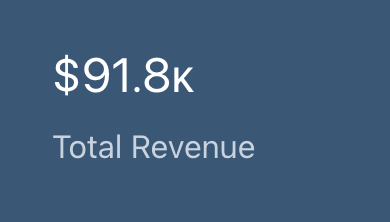
Metric
A Metric is a quantitative value, such as revenue or exchange rate. You can “do math” on measures.
Example: Calculating total revenue
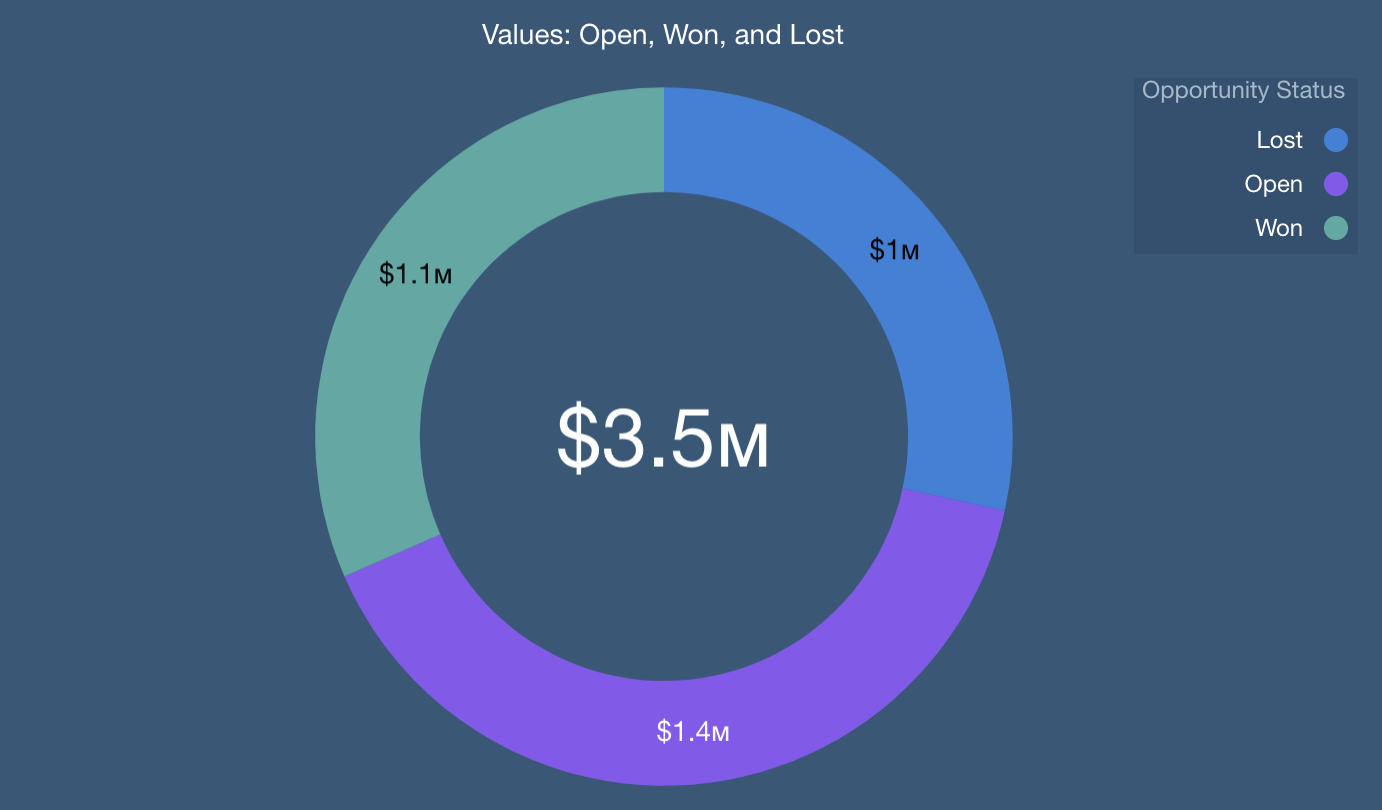
Dimension
A Dimension is a qualitative value that’s useful for grouping and filtering your data.
Example: Region, product name, model number, or Opportunity Status
Group
A Group is a collection of data based on a specific dimension.
Example: Product name or account.
Access and navigation within B2BMA
How do I get a license?
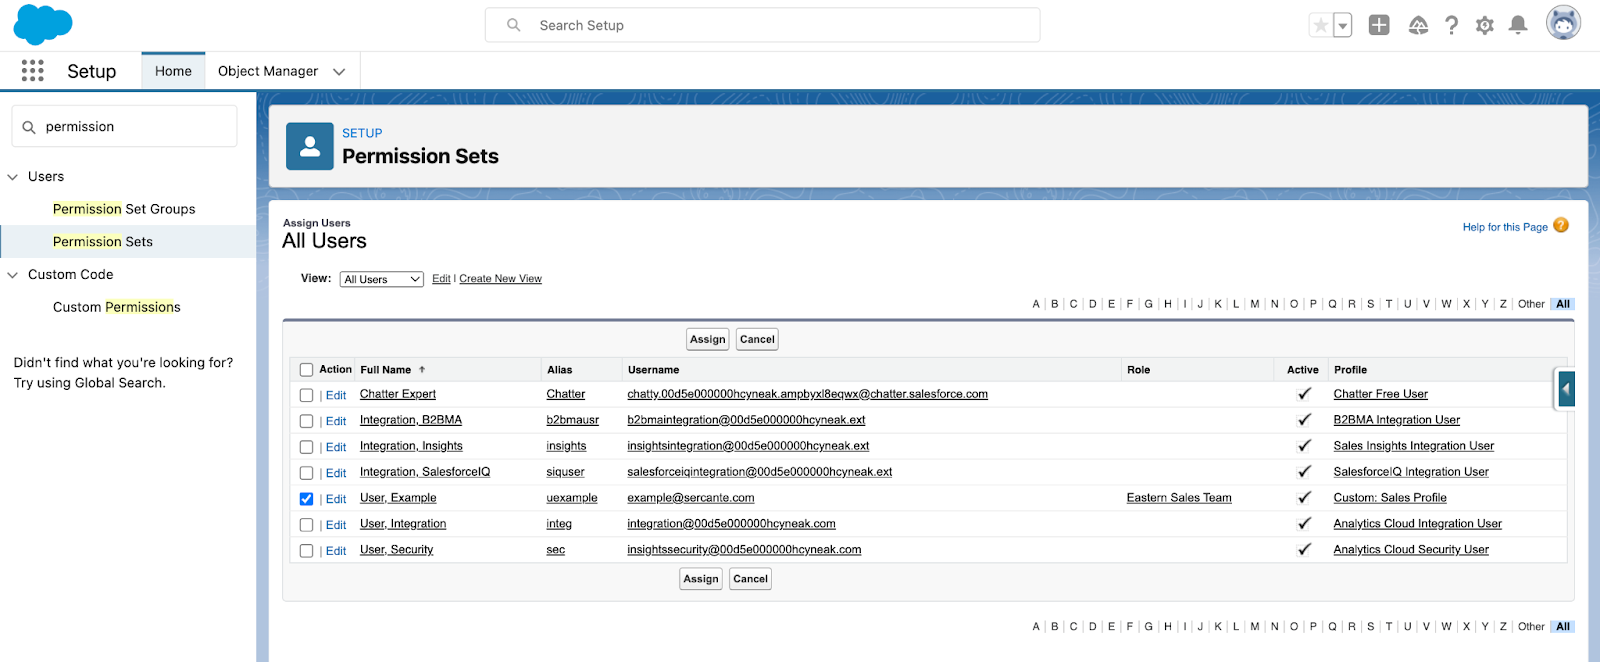
Access to B2B Marketing Analytics is dictated by the number of licenses you have. To check your licenses, go to Setup > “Company Information” via the Quick Find box > Scroll down to “Permission Set Licenses” and look for “B2B Marketing Analytics”.
Where do I find it?
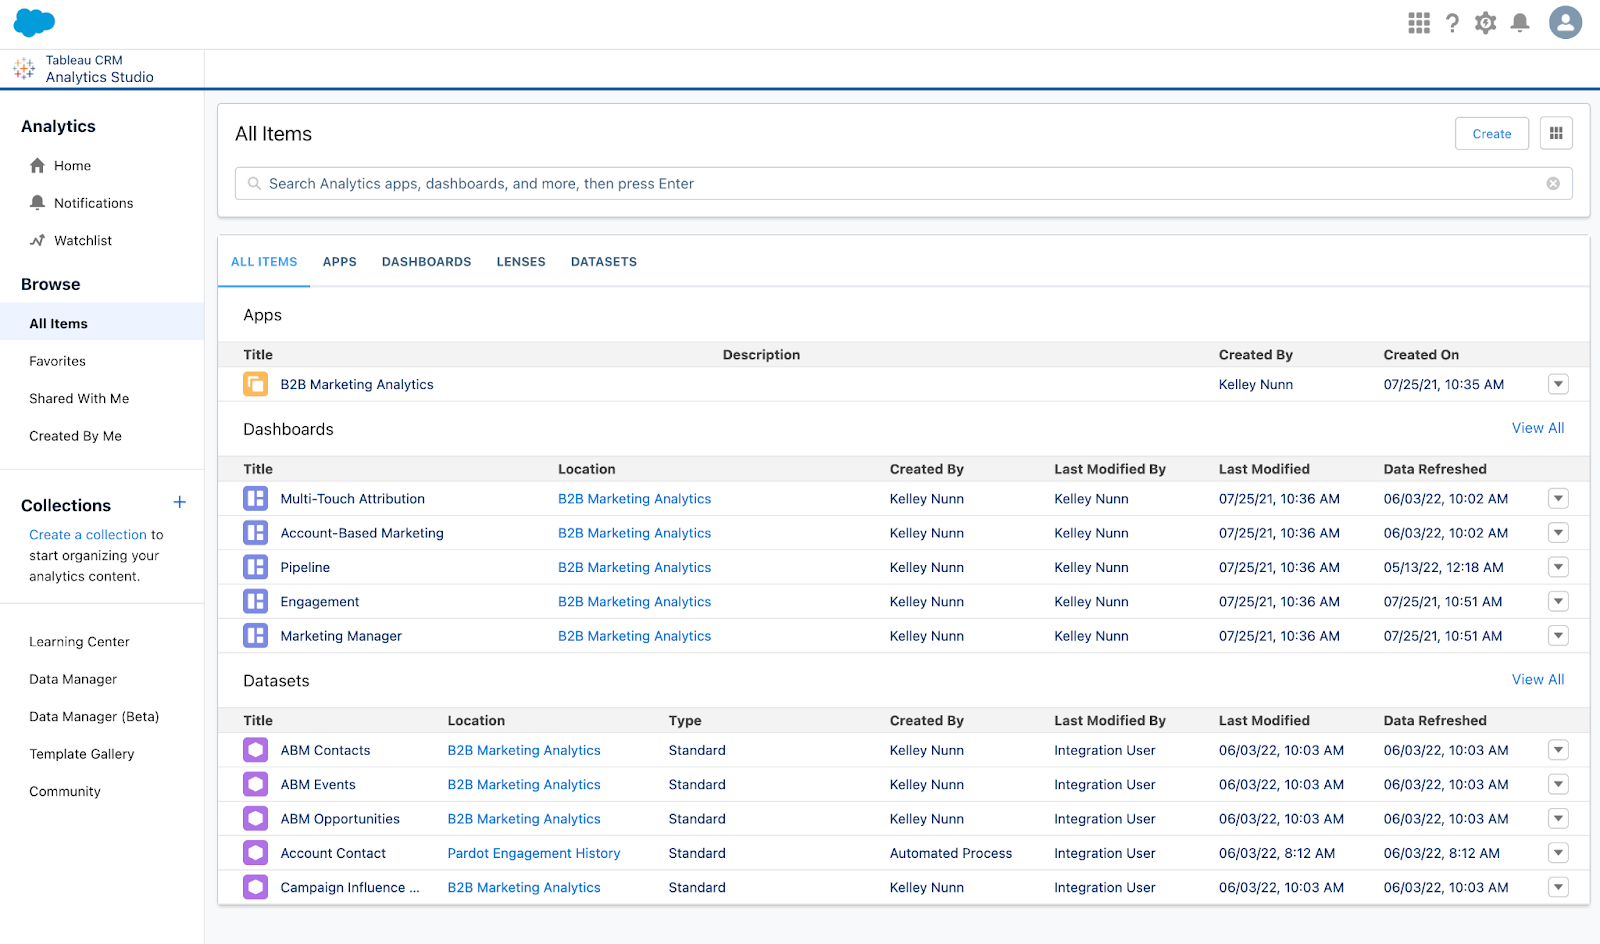
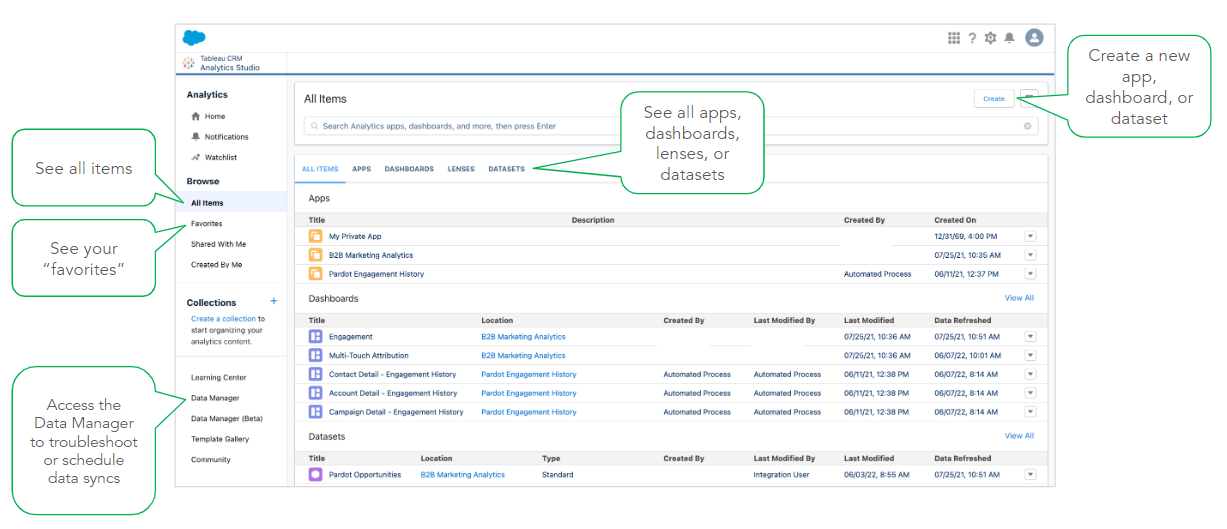
Access the Analytics Studio App by clicking the App Launcher and typing in “Analytics Studio.” Select “All Items” in the sidebar under “Browse,” then click “B2BMA Analytics” under “Apps.” Open the default dashboards and start exploring them
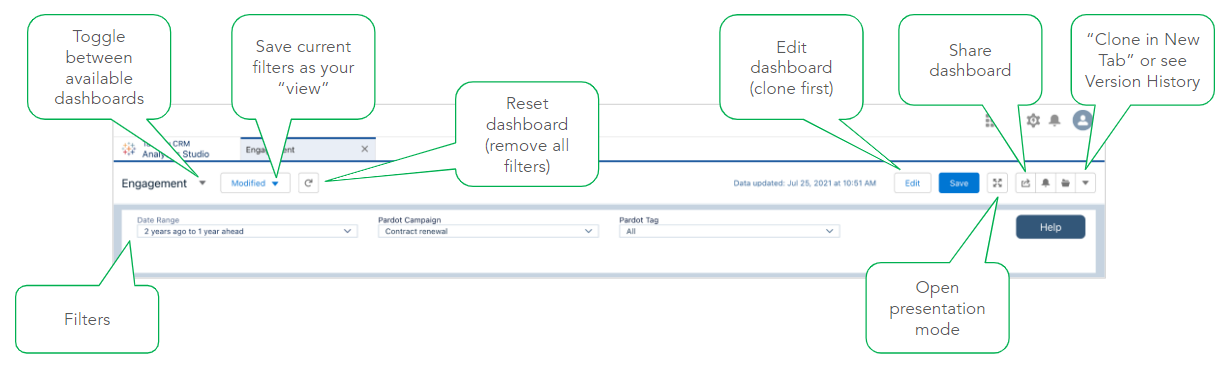
How to navigate B2BMA
Considerations for default B2BMA dashboards
The default dashboards are designed for a general audience, so they may need to be customized to suit your organization
We don’t recommend editing or saving over the default dashboards. Instead, make a copy of the dashboard by clicking the “Clone in New Tab” option. Salesforce makes regular updates to the default dashboards, which will overwrite any changes you have made (only when you choose to “reconfigure” the app).
Reach out to Sercante with any questions regarding B2BMA customization capabilities.
Exploring and sharing B2BMA dashboards and datasets
Within B2BMA, you can dive deep into the data using “Explore” functionality, viewing different lenses and reviewing the datasets, fields and filters. You can also share dashboards, giving access to critical team members, post the dashboards to feeds, export them or download them.
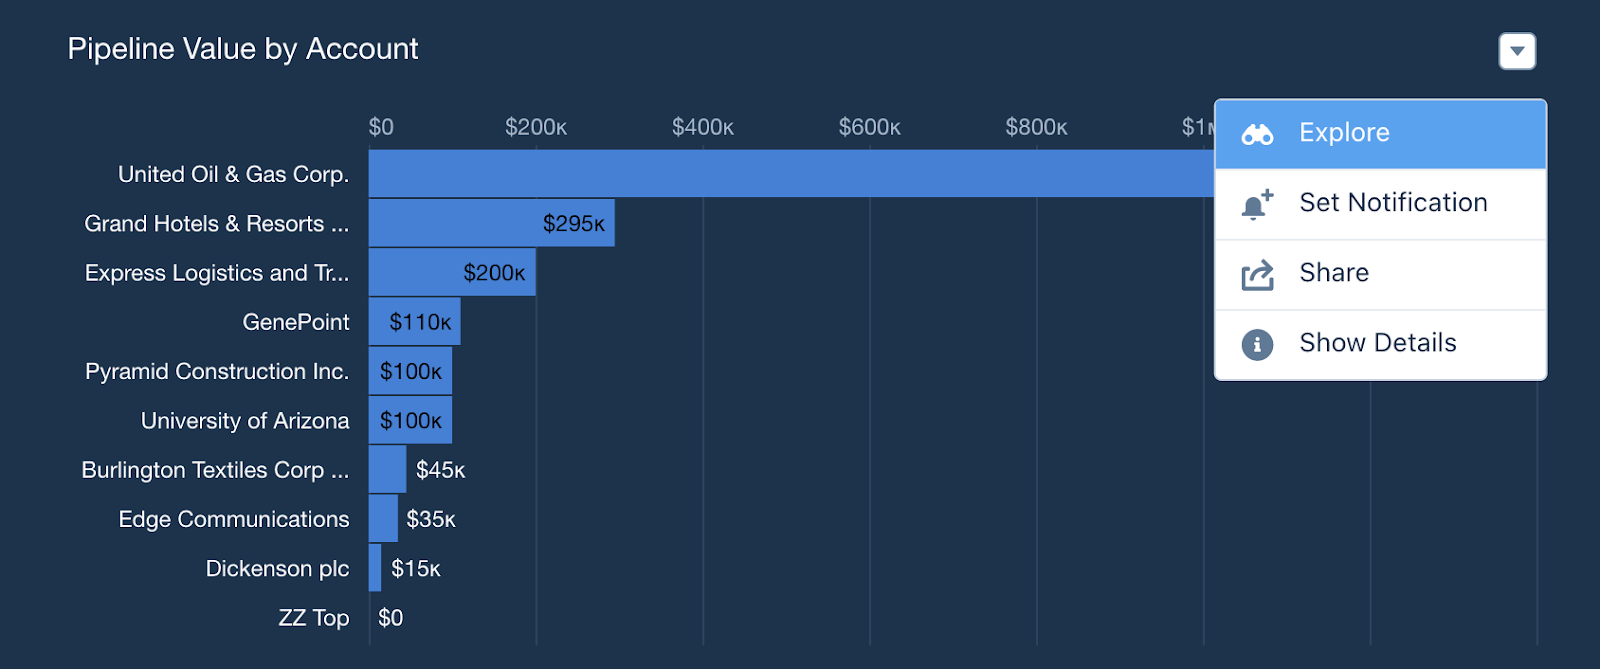
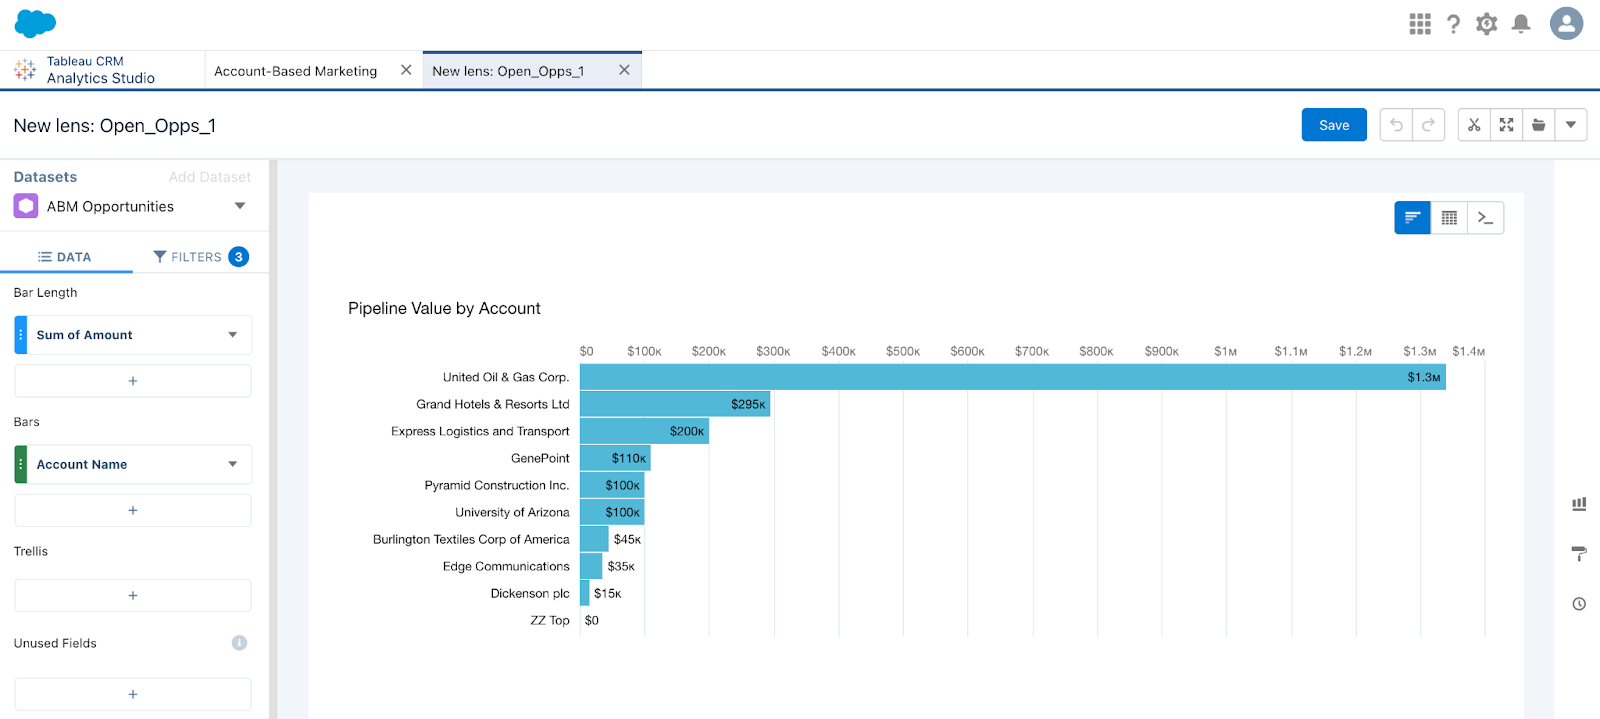
Exploring
Want to know more about the data behind the chart? Click “Explore” to open a copy of the lens and review the datasets, fields, and filters. You can switch the visualization to a table view
Note: Not all filters will be shown here – click the “query mode” button to see all details
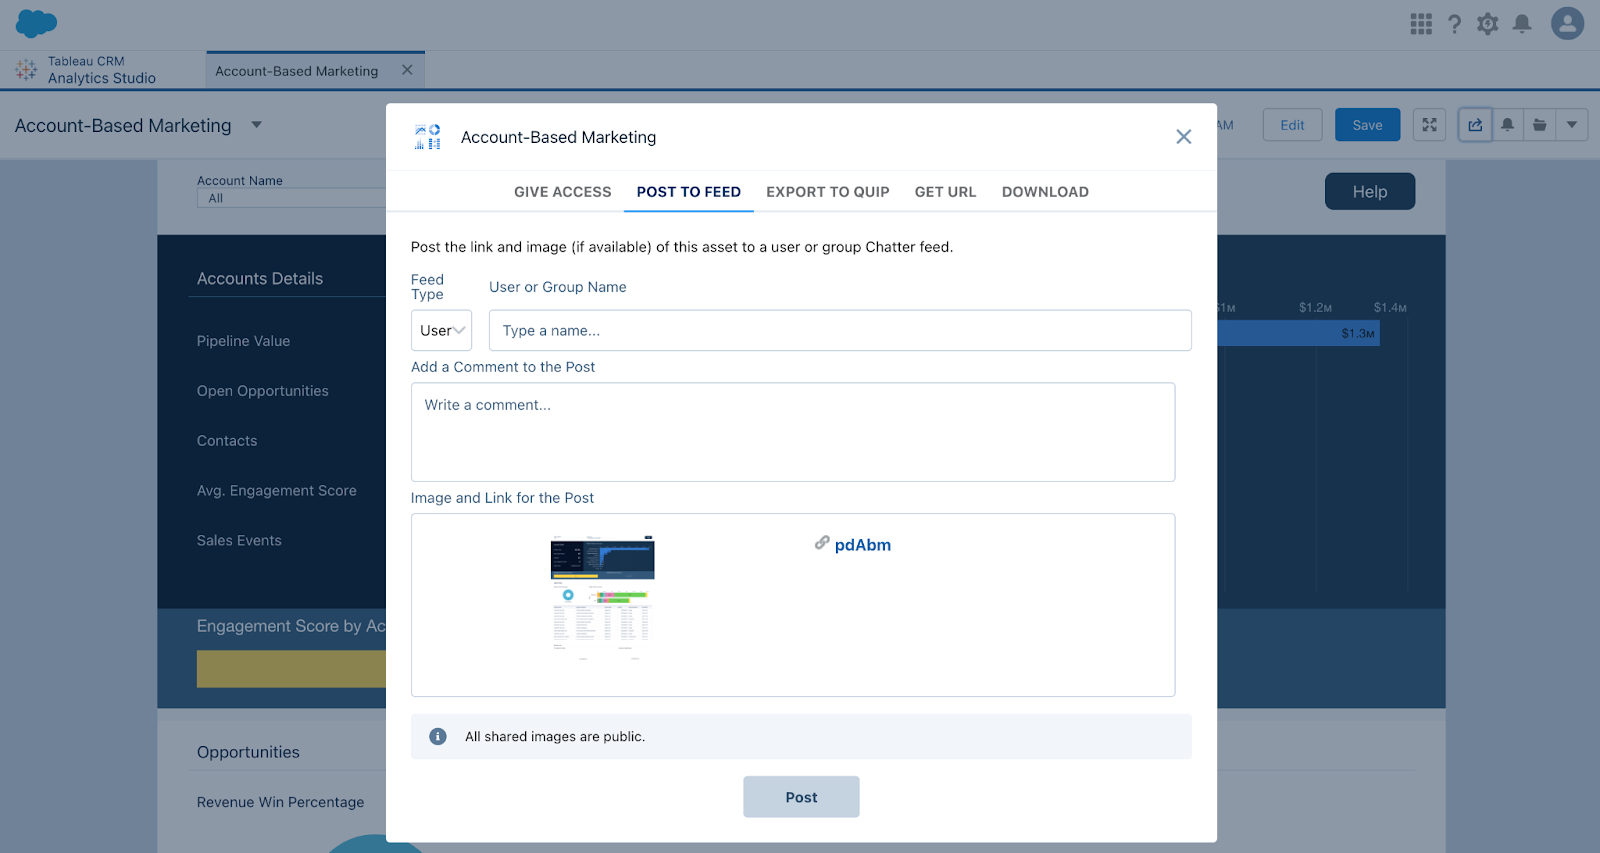
Sharing
Clicking the “Share” button at the dashboard level gives you:
- Give access – Showing who has access to the dashboard
- Post to a Chatter feed
- Export to quip
- Get URL – only users with access to the dashboard can view the link
- Download – download an image of the full dashboard
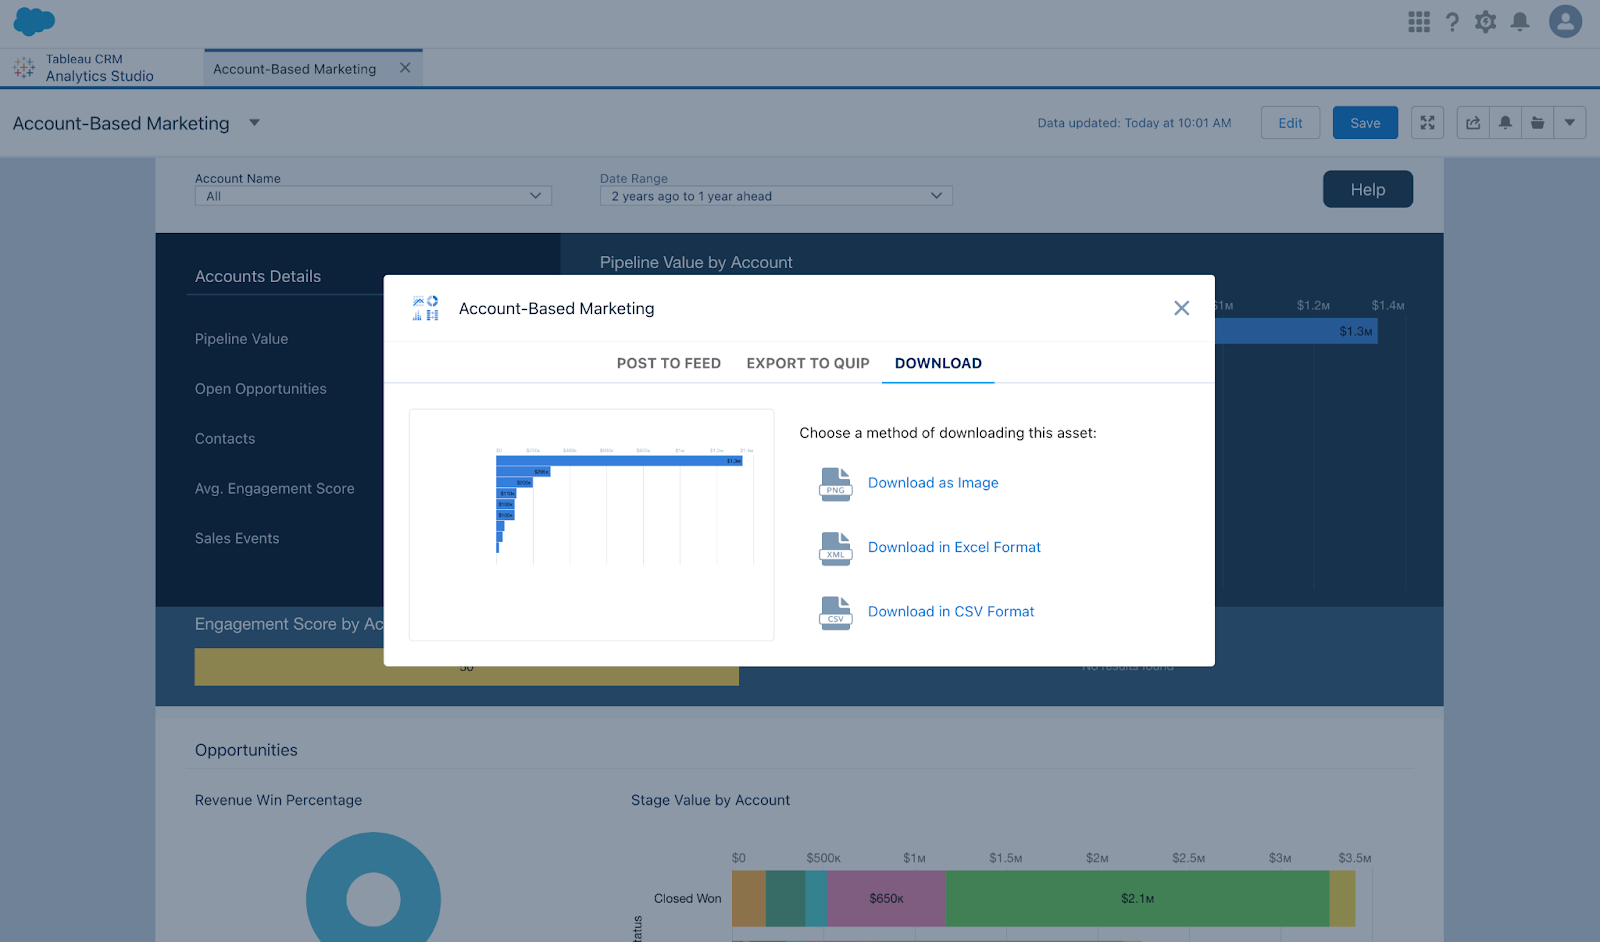
Clicking the “Share” button at the lens level gives you:
- Post to a Chatter feed
- Export to quip
- Download – download an image of the full dashboard or a CSV/Excel file
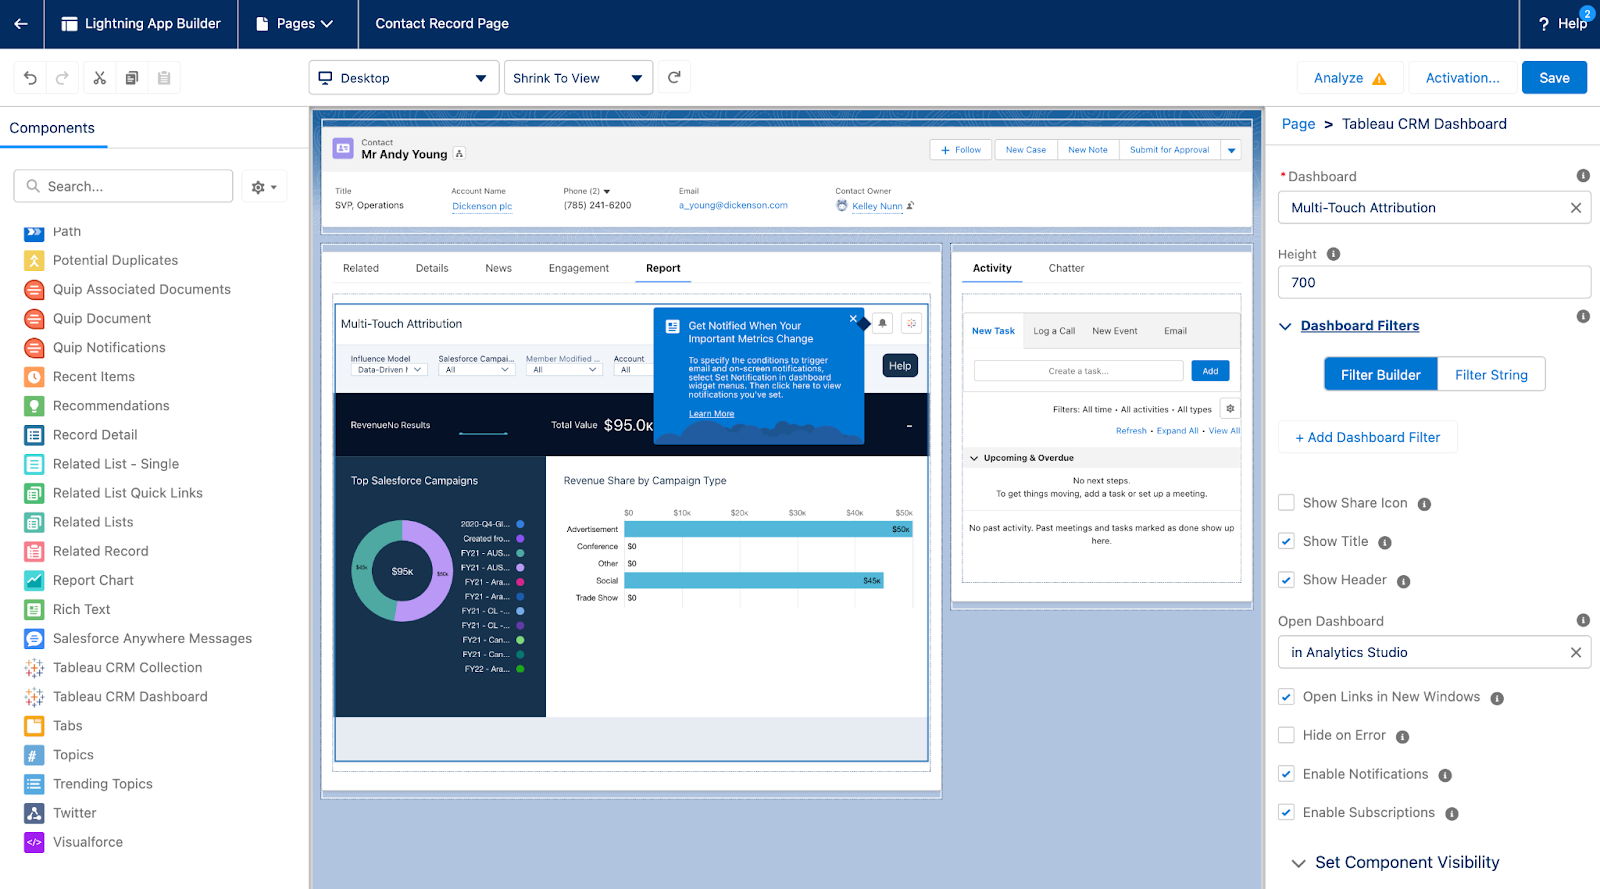
Adding to Lightning Pages:
- You can embed your B2BMA dashboards in Lightning Record Pages in SFDC
- Use the “Tableau CRM Dashboard” component
- Only users with the B2B Marketing Analytics permission set assigned will be able to view the embedded dashboard
Ok – I understand everything else. Now how do I make updates to B2BMA?
B2BMA updates become available on the regular SFDC release schedule.
How do I know if there’s an update?
- If an update is available, you’ll see the “Reconfigure app” option when you open the B2B Marketing Analytics app
- Click “Reconfigure app” and go through the steps to update
- The updates aren’t required – you don’t have to do them if you don’t want to
- Click the info icon to see what new features are available so you can determine if it’s worth upgrading
Engagement History Dashboards
Engagement History Dashboards looks at your various marketing assets (forms, landing pages, emails, etc.) and how they are performing. They also look at how they contribute to your opportunity and sales pipeline.
Engagement History Dashboards are powered by CRM Analytics.
They allow you to:
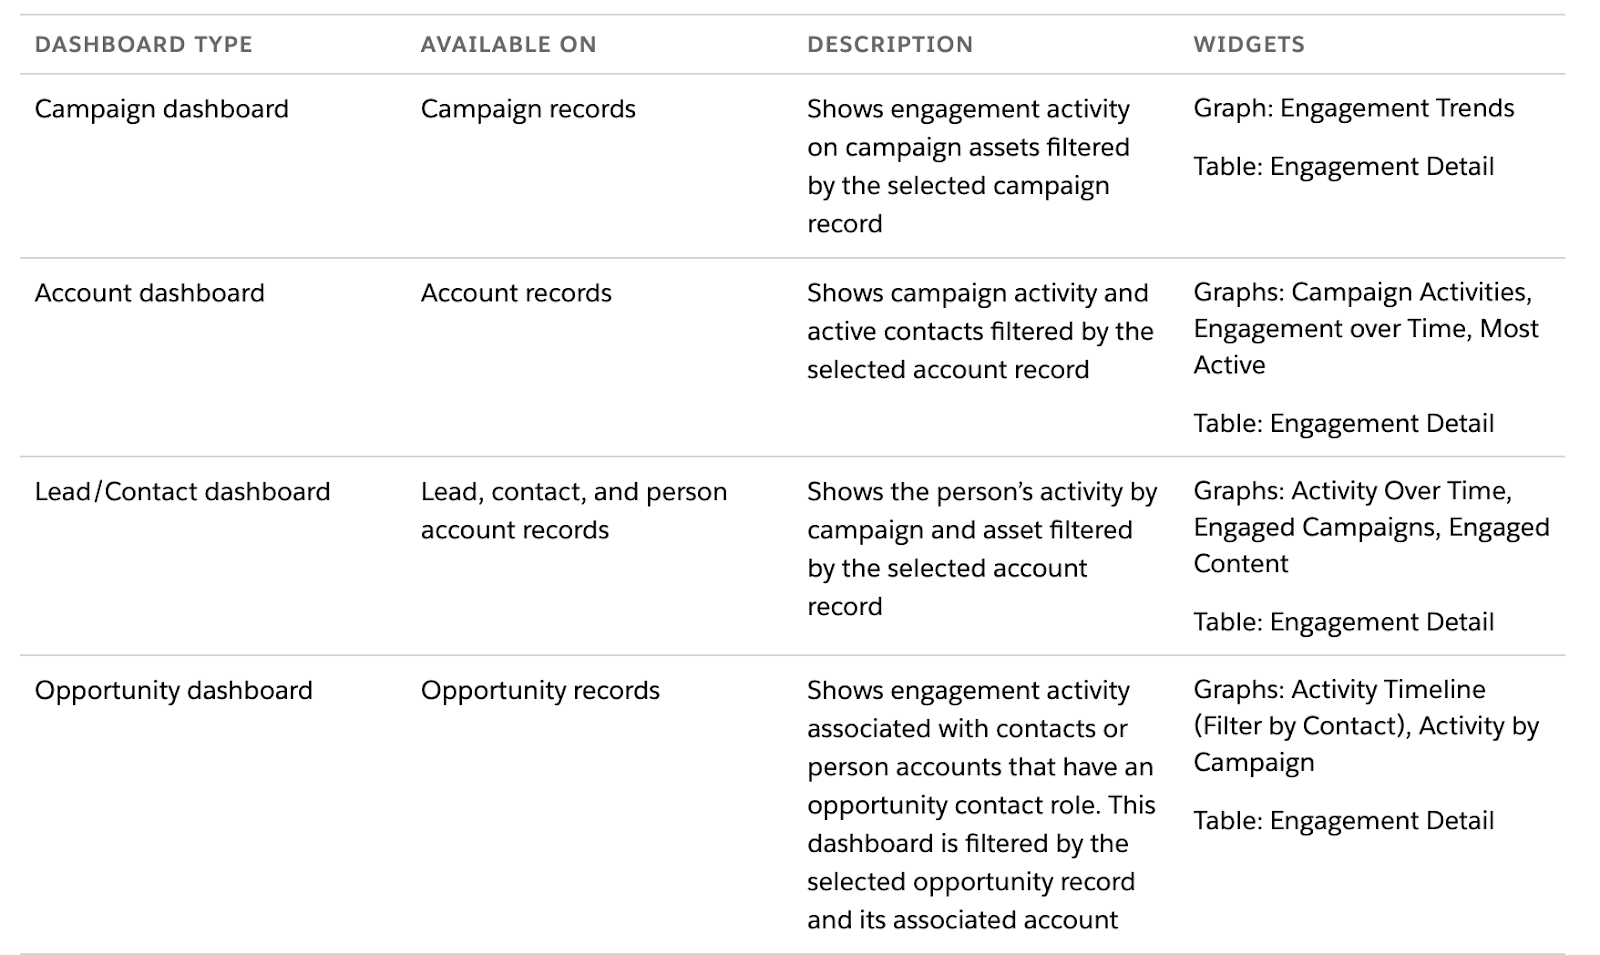
- Visualize engagement data on a variety of records
- Show slightly different data based on the object (e.g. Opportunities, etc.)
- Filter to show data relevant to the specific record that’s being viewed
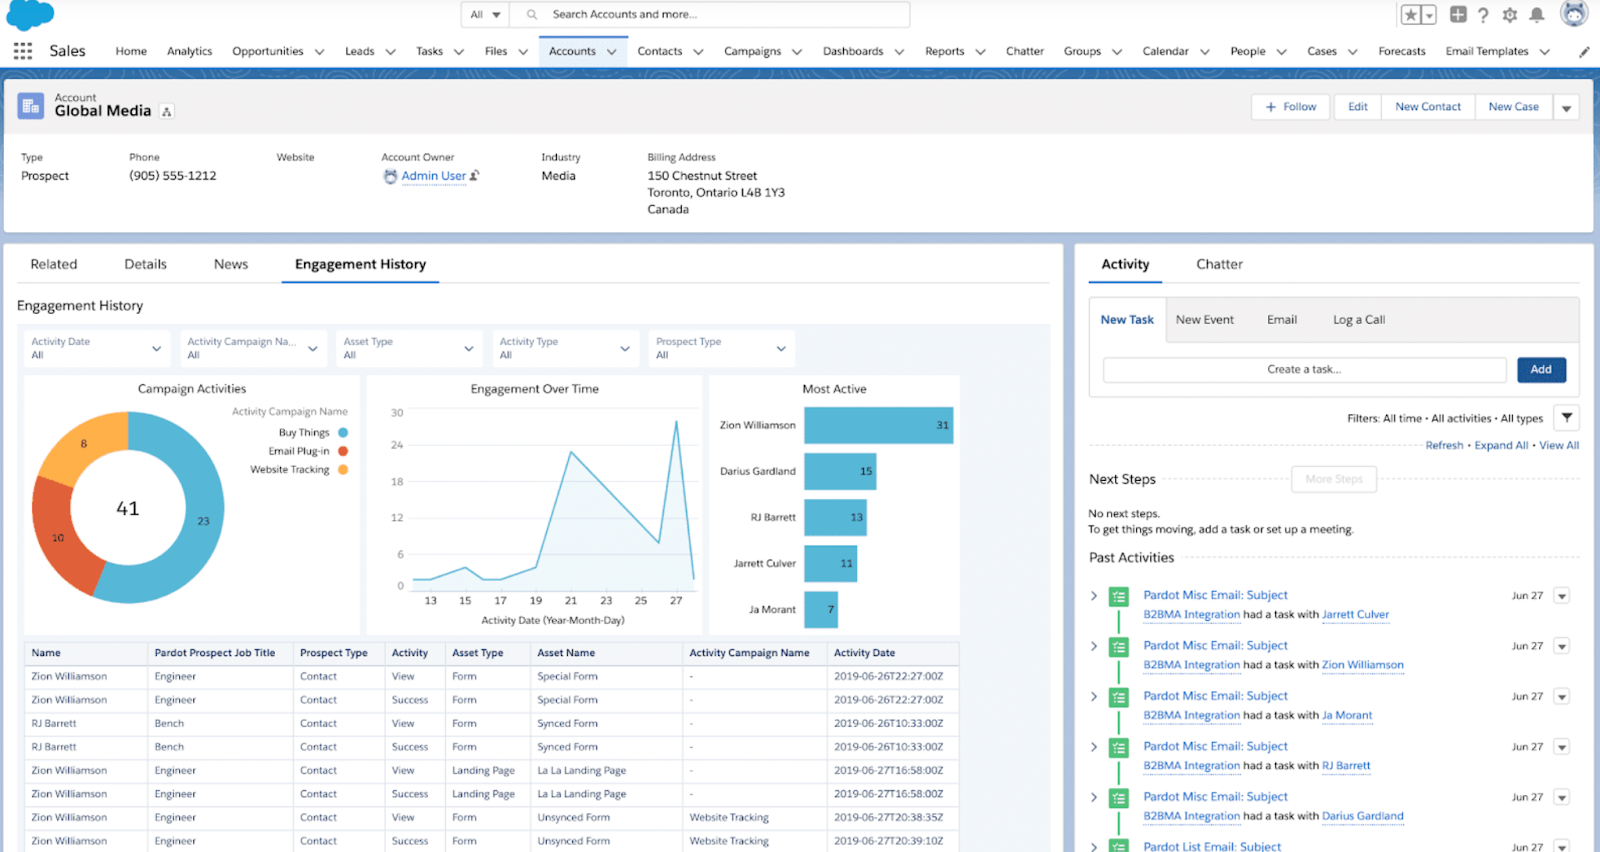
What does this look like on the Account object?
On a given Account, click the “Engagement” tab to see the most active Contacts and the Campaigns they’re engaging with. Use the filters to apply a date range, choose an asset type, etc.
Engagement History Dashboards on Page Layouts
At this point, you’ve probably added Engagement History Dashboards to these Page Layouts:
- Campaigns
- Accounts
- Contacts
- Opportunities
Only users that have been assigned the “Analytics View Only Embedded App” permission set can see these dashboards. Your Account Engagement edition determines how many licenses are available.
Considerations for Engagement History Dashboards
Here are a few things you should keep in mind about these dashboards:
- The “Analytics View Only Embedded App” gives users access to Engagement History Dashboards, but not Analytics Studio/B2B Marketing Analytics
- We recommend assigning this permission set to your Sales & Marketing leads
- Engagement History Dashboards aren’t supported in Internet Explorer 11
- Dashboards embedded on Leads, Contacts, or Person Accounts can only show data for one Business Unit at a time (delete if your client doesn’t have multiple MCAE BUs)
- The Opportunity dashboard relies on Opportunity Contact Roles and dates
- If data is missing from the Opportunity dashboard, it’s usually because no Opportunity Contact Roles are assigned
- For emails sent through Engagement Studio, the Account Engagement Engagement History dataset includes send data only for programs that were created after December 14, 2018
Learn more about B2B Marketing Analytics
B2BMA is an incredibly valuable CRM analytics tool to help improve your visibility into your marketing and sales data, including many out-of-the-box dashboards built for a variety of stakeholders in your business.
Here at Sercante, we’re a huge fan of the Salesforce Trailblazer community. We highly recommend bookmarking the B2B Marketing Analytics Implementation Guide – a comprehensive resource that includes dataset information, field definitions, etc.
You should also check out these blog posts to learn more about B2BMA and what it can do for you:
- Demystifying Pardot B2B Marketing Analytics Plus
- Using Pardot B2BMA as a Data Audit Tool
- Recipe for success: Pardot B2BMA columns to rows
Have any B2BMA roadblocks you’re looking to solve? Reach out to the team at Sercante or tell us about it in the comments.